Reminder
You can subscribe to my blog by scrolling to the bottom of the article, typing in your email address and clicking the green "Notify Me!" button. Once subscribed, my articles will be sent directly to your email as soon as Trading Places articles are published. Thanks!
Market Recap for Thursday, August 24, 2017
The 800 lb. gorilla has spoken. Amazon.com (AMZN) announced that Whole Foods Market (WFM) would be cutting their prices and that its Prime members would see discounts on WFM purchases. That was enough to send competitors reeling. Consumer staples (XLP, -1.38%) badly lagged as food retailers & wholesalers ($DJUSFD) dropped a collective 4.12% on Thursday. Kroger (KR), the largest grocer in the U.S., tumbled 8.10% to close at 21.10, its lowest level since early 2014. Here's a look at the KR daily chart:
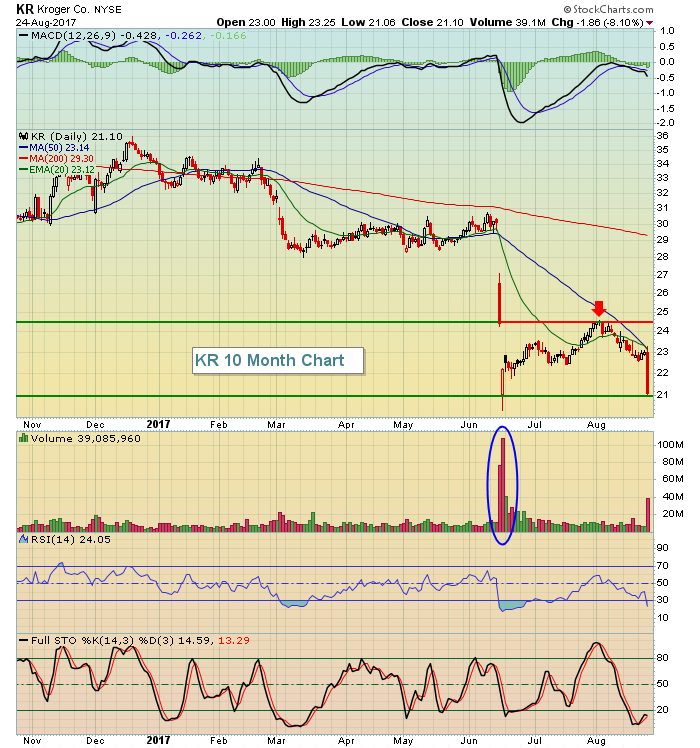 Remember, KR had to weather a double storm in June - poor earnings and AMZN's announcement that it would acquire WFM. That red hollow candle established a bottom that was nearly tested yesterday, while gap resistance was tested with the early August high.
It wasn't just KR, however, that was dragged lower yesterday. Sprouts Farmers Market (SFM), Supervalu (SVU), United Natural Foods (UNFI), and several others among food retailers were crushed on the latest AMZN announcement. The damage spread to broadline retailers like Costco (COST), Target (TGT), and Wal-Mart (WMT), which fell 5.04%, 3.99% and 2.03%, respectively. Broadline retail ($DJUSRB, -1.06%) was easily the worst performing industry within the consumer discretionary (XLY, -0.21%) space.
Healthcare (XLV, +0.29%) managed to eke out gains, thanks in large part to biotechnology ($DJUSBT, +0.89%) and medical supplies ($DJUSMS, +0.73%).
Pre-Market Action
Bonds, crude oil and gold are all near the flat line this morning. Asian markets were mostly higher overnight and European markets are following suit this morning.
That's helped to generate a positive bias in the U.S. this morning. Dow Jones futures are higher by 35 points with 30 minutes left to the opening bell.
Current Outlook
The Russell 2000 ($RUT) was the only major U.S. index to finish Thursday's session in positive territory as it continues its bounce off support near 1350 and approaches key resistance at its declining 20 day EMA. That's the range for now, as you can see below:
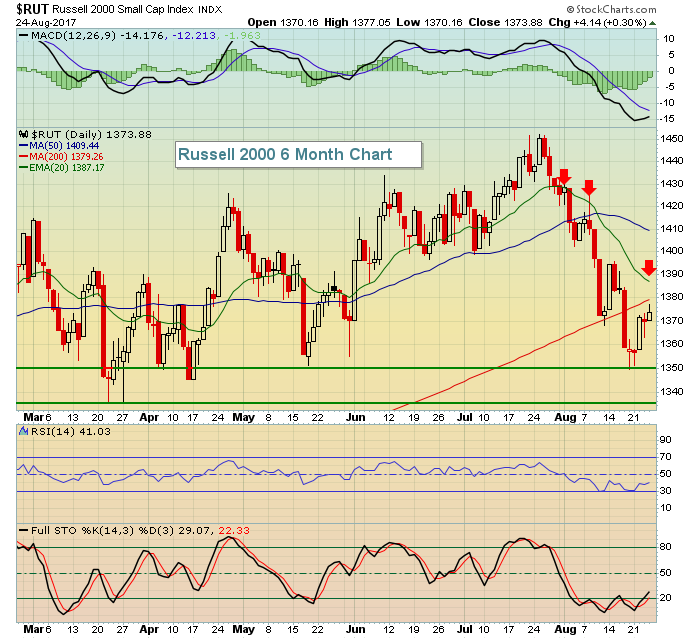 The RUT bounced off the top of key short-term price support and is now trending higher. We've already seen a couple failures at the declining 20 day EMA earlier this month. So consider 1350 as initial support and 1387 as key resistance.
Sector/Industry Watch
Home construction ($DJUSHB) has been struggling the past several days, falling from nearly 730 to yesterday's close at 694. This is the level of the early July breakout so it would be bullish to see this group turn at this level. Check it out:
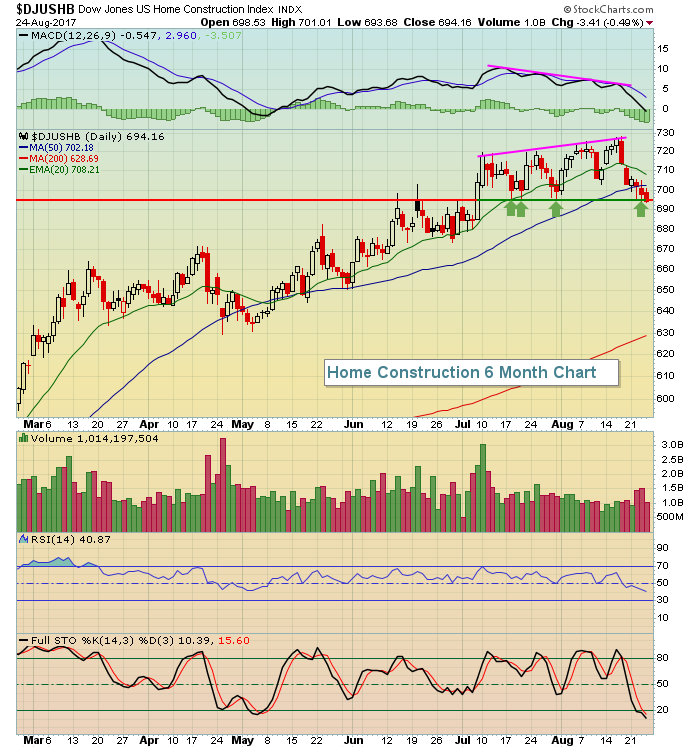 The negative divergence can at least be partly blamed for the recent price weakness. However, we've now seen a MACD centerline test and we're trading slightly below the 50 day SMA. Price support at the current level has been tested successfully on multiple occasions the past two months so I view this level as very important support on the daily chart. The biggest level in my view is the rising 20 week EMA, currently at 680, on the weekly chart. If current price support is lost, look to that level next. I'd be a buyer on that 20 week EMA test.
Historical Tendencies
I keep an Excel spreadsheet of monthly historical returns for each NASDAQ 100 stock. I sorted this spreadsheet by highest percentage of historical gains during the September to December period. For example, Akamai (AKAM) came out on top because 116% of its gains were achieved during the final four months of the year (over the last 19 years). Put another way, AKAM has a very strong tendency to perform well over the balance of the year. Here's AKAM's seasonality chart:
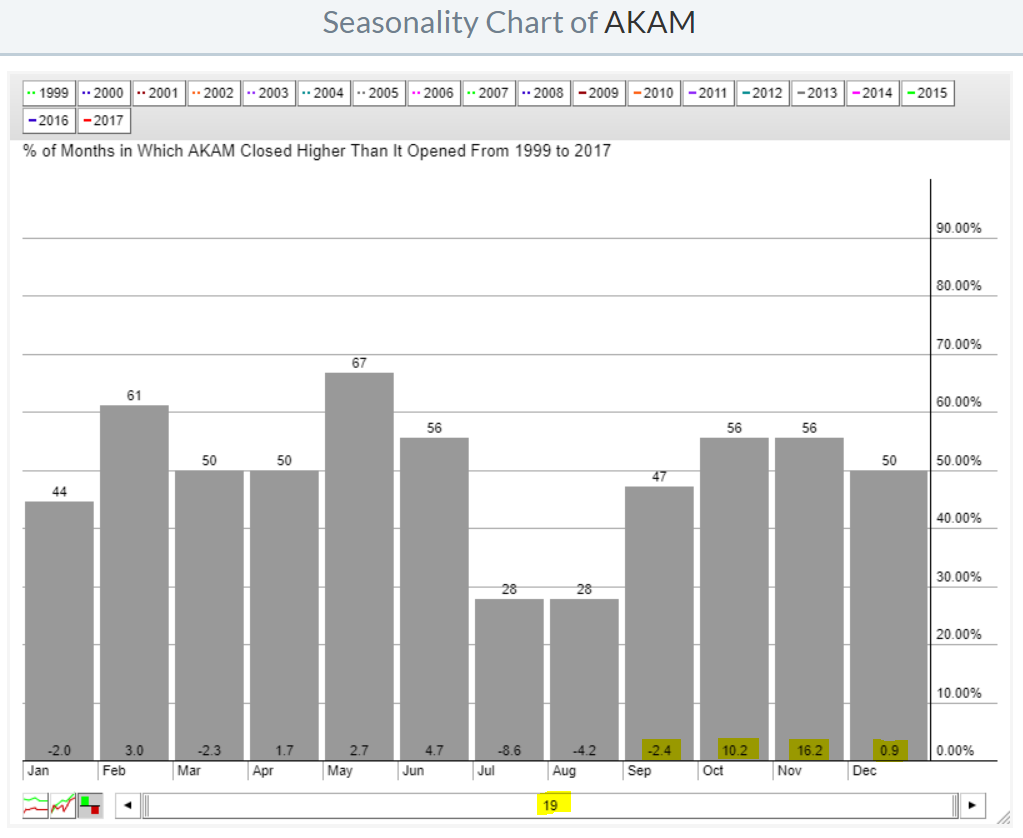 Here are a few words of caution about jumping in at the current price. First, the default five year look at AKAM's seasonality is not nearly as strong for the September to December period. Second, AKAM's technical picture is not good right now. So I'd need to either see a break above the declining 20 week EMA before I'd get interested here or perhaps test February 2016 price support closer to 40. A weekly positive divergence to accompany that price support test would look much more bullish than what we see currently.
I will discuss other top performing stocks (historically) during the September to December period during my MarketWatchers LIVE show that starts at noon EST. Please join me and Erin Wood! The room opens at 11:45am EST. CLICK HERE after 11:45 and come on in!
Key Earnings Reports
None
Key Economic Reports
July durable goods released at 8:30am EST: -6.8% (actual) vs. -5.8% (estimate)
July durable goods ex-transports released at 8:30am EST: +0.5% (actual) vs. +0.4% (estimate)
Fed Chair Yellen will speak at the Jackson Hole Symposium at 10:00am EST
Happy trading!
Tom
