Market Recap for Wednesday, August 9, 2017
U.S. equities were under early fire on Wednesday, but there was a steady recovery throughout the balance of the day with little technical damage done by session end. The Russell 2000 was one exception, however, as that aggressive small cap index closed beneath 1400 for the first time in the past 6-7 weeks. That weak performance followed a 20 day EMA test from underneath with that moving average now threatening a death cross beneath the 50 day SMA. Check it out:
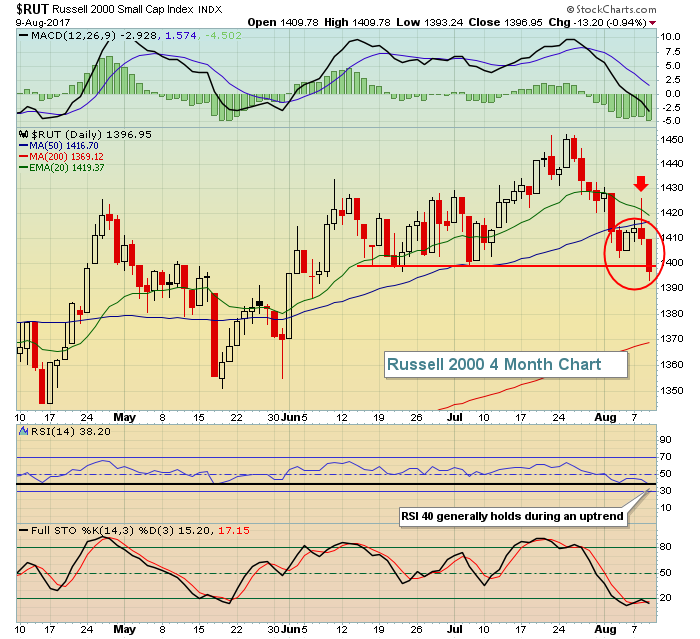 The red circle highlights more-than-normal bearishness as the Russell 2000 broke beneath its 50 day SMA. But instead of quickly regaining it, it tested the 50 day SMA from underneath and then pushed to fresh recent lows yesterday. This behavior suggests more weakness ahead.
The buying yesterday afternoon triggered gains in consumer staples (XLP, +0.16%) and healthcare (XLV, +0.11%) - both defensive sectors. Meanwhile, at the other end of the spectrum, consumer discretionary (XLY, -0.58%) and utilities (XLU, -0.52%) suffered mild losses. The latter was somewhat surprising as falling 10 year treasury yields ($TNX) typically boost this sector and the TNX was down substantially at Wednesday's open, although it did rise throughout the balance of the day.
Pre-Market Action
Gold ($GOLD) is up solidly this morning as more fear creeps into the U.S. stock market. Yesterday, the Volatility Index ($VIX) hit 12.63, its highest level in a month. GOLD has a very significant downtrend line test near $1300 and black gold has now climbed within about 1% of that critical level. Gold bulls are hoping to clear that hurdle and begin a new bull market in that area. Crude oil ($WTIC) is up 1.25% this morning, back above $50 per barrel. Let's see if that helps energy (XLE) regain its footing.
Dow Jones futures are weak this morning, down 48 points as we prepare for the opening bell in 30 minutes.
Current Outlook
I'd like to see transportation stocks ($TRAN) begin to support this bull market, but the action lately is actually confirming more weakness ahead. Check out the failed test at the now-declining 20 day EMA and the short-term outlook for the group below:
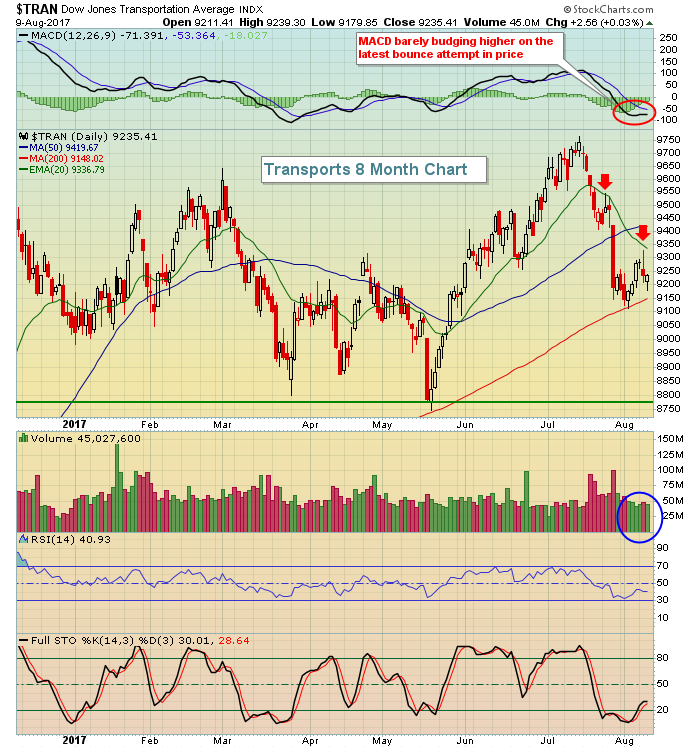 This bounce looks feeble and quite suspicious to me. The MACD's response to this failure is uninspiring and the volume to support the bounce is lacking as well. I see lower prices ahead for transports, perhaps challenging the mid-May low near 8775 over the course of the summer.
Sector/Industry Watch
It's a good time to check in on the railroads ($DJUSRR) given the rather bearish short-term outlook on transports in general. Here's the latest daily chart:
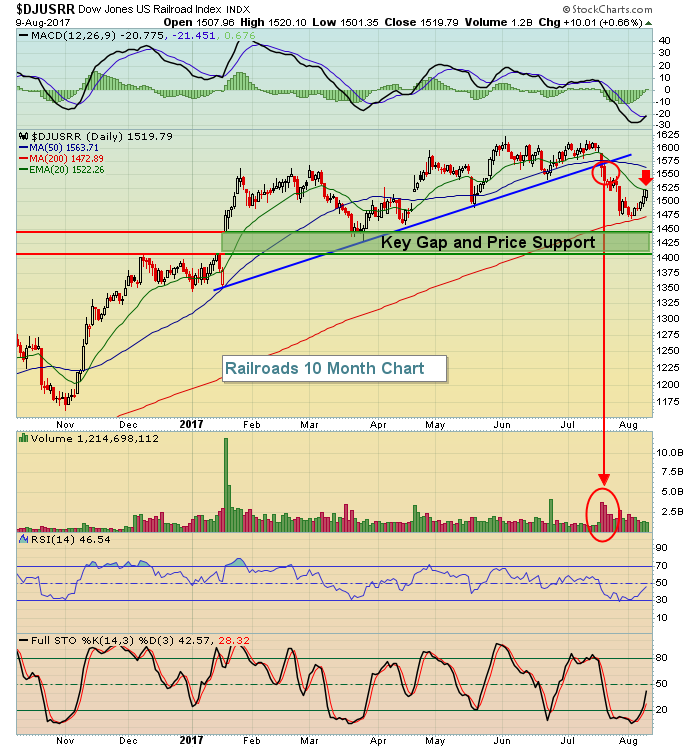 This looks ugly to me. The uptrend line was broken on exceptionally high volume, a sign of distribution. The bounce attempt to the declining 20 day EMA was on very light volume. Not pictured above is a nasty negative divergence on the longer-term weekly chart. That usually requires a 50 week SMA test, and that moving average is currently at 1437, right in the middle of the gap and price support zone shown above. I see at least a drop to 1450 on the DJUSRR. I believe it's too soon to buy. The next drop may very well form a positive divergence as the DJUSRR hits support on both its daily and weekly charts. That would be a much better reward to risk entry into this group.
Historical Tendencies
Ctrip.com (CTRP) tends to perform very well during the dog days of summer and its chart remains technically sound, despite priceline.com's (PCLN) poor reaction to its latest earnings report. CTRP is currently residing on its rising 2o day EMA in a clear uptrend and it should benefit from seasonal tailwinds based on this seasonality chart:
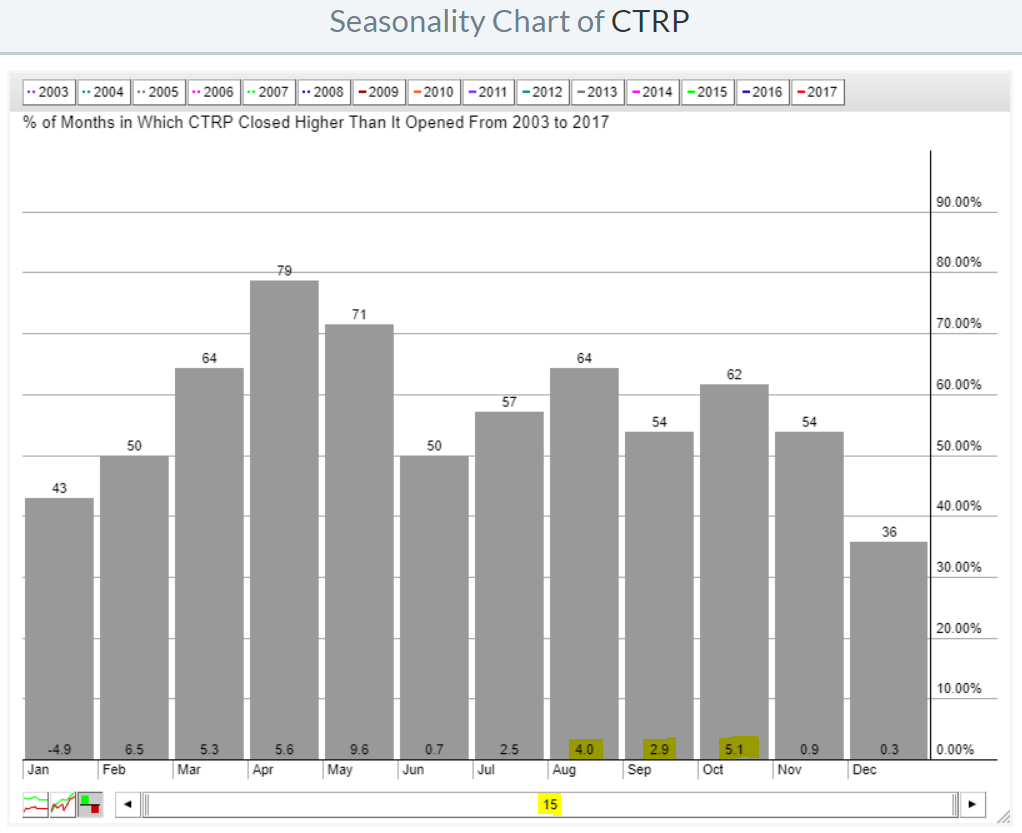 The February to May period is clearly CTRP's sweet seasonal spot, but August through October isn't bad. I'd continue to pay closest attention to the technical behavior of the stock, but seasonal strength here won't hurt.
Key Earnings Reports
(actual vs. estimate):
BR: 1.71 vs 1.68
CCE: .74 vs .64
KSS: 1.24 vs 1.18
PRGO: 1.22 vs .94
(reports after close, estimate provided):
JWN: .62
NVDA: .69
PBR: .15
SNAP: (.29)
Key Economic Reports
Initial jobless claims released at 8:30am EST: 244,000 (actual) vs. 241,000 (estimate)
July PPI released at 8:30am EST: -0.1% (actual) vs. +0.1% (estimate)
July Core PPI released at 8:30am EST: -0.1% (actual) vs. +0.2% (estimate)
Happy trading!
Tom
