Market Recap for Monday, August 21, 2017
Healthcare (XLV, +0.45%) led the market's advance on Monday's total solar eclipse day as money rotated into more defensive areas of the market. Utilities (XLU, +0.37%) and consumer staples (XLP, +0.36%) also benefited and this move towards safety could be seen in our major indices as well. The Dow Jones and S&P 500 were able to post minor gains while the more aggressive NASDAQ and Russell 2000 ended in negative territory.
While the XLV has fallen beneath key moving averages on its daily chart, stepping back to the bigger weekly picture tells a different, more bullish, story:
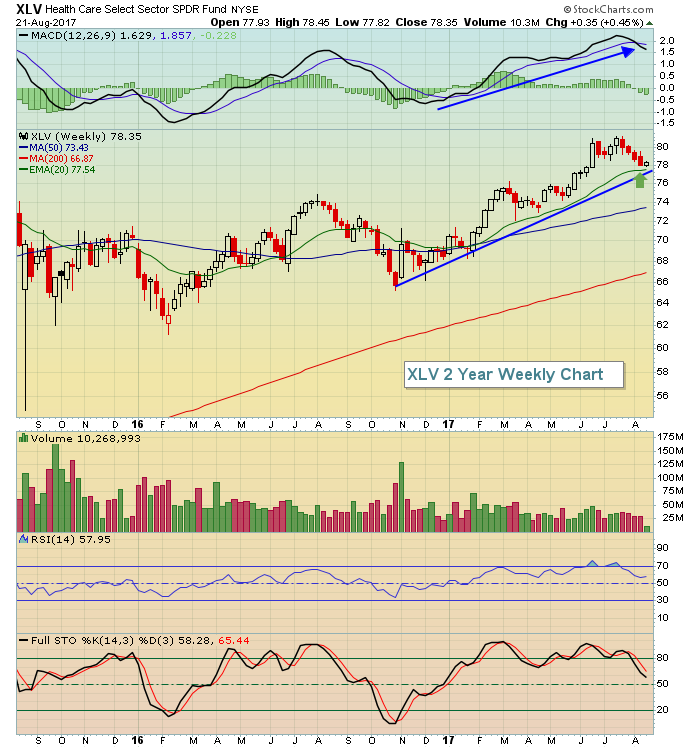 The trendline remains intact, the rising 20 week EMA has been holding as support and the recent selling has enabled the weekly RSI to drop from overbought territory near 80 to a much more palatable 58 level. Further consolidation or selling in the S&P 500 during the balance of August and into September could see this weekly RSI dip into the 40s, an even better level. I believe the rising 20 week EMA is going to hold this group.
A very familiar lagging group - energy (XLE, -0.32%) - once again couldn't find a bid and finished the session at the bottom of the sector leaderboard. The interesting part is that crude oil ($WTIC) had actually bounced a bit the past few trading sessions, but the XLE still closed yesterday at its lowest level of 2017. Continue to avoid this space.
Pre-Market Action
Gold ($GOLD) and crude oil ($WTIC) are both fractionally lower as the equity bulls regain their footing this morning. The Hang Seng Index ($HSI) rose nearly 1% overnight in Asia and European indices are higher this morning, helping to provide a lift to U.S. futures. The German DAX ($DAX) is up over 1% this morning.
Dow Jones futures are up 59 points as U.S. stocks look to begin the day in positive territory.
Current Outlook
The 60 minute MACD has finally turned higher on the S&P 500 so I'll be watching for one of two things in the near-term - either a breakout above the declining 20 hour EMA or a fresh low accompanied by a positive divergence. In either event, it appears as though the S&P 500 may have reached a near-term bottom, or is very close to doing so. Here's the 60 minute chart:
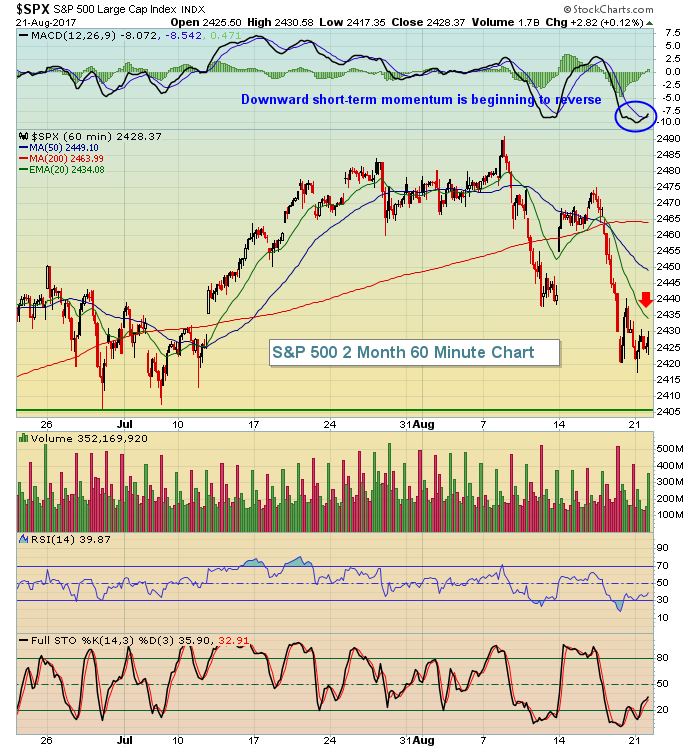 Based on the above chart, the short-term trading range on the S&P 500 is from 2405 (late June price low) to 2434 (declining 20 hour EMA). Just keep in mind that if the S&P 500 does weaken further and it tests that 2405 level, it'll likely do so with a positive divergence in play. I'd be a buyer at that level for a more significant bounce. In the meantime, a break above that declining 20 hour EMA would also provide the bulls a short-term lift.
Sector/Industry Watch
Weekly negative divergences continue to plague our major indices here in the U.S. and most sectors have printed those signs of slowing momentum as well. While technology (XLK) remains well above its rising 20 week EMA, it has the potential for the largest losses over the next several weeks because it has the largest potential drop to its 50 week SMA to reset its MACD close to or at centerline support. Among the aggressive sectors, the XLK is the only one that still hasn't even tested its 20 week EMA:
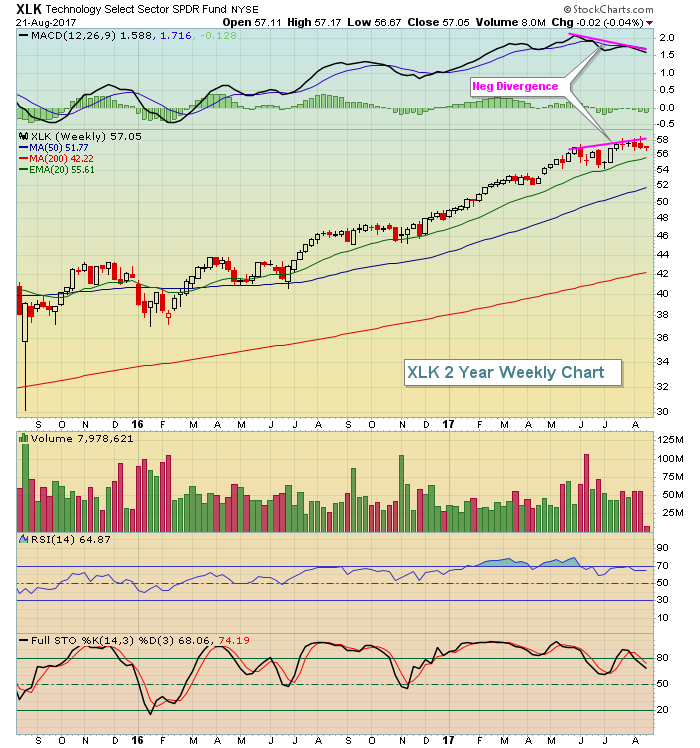 Sometimes bull markets can overcome bearish technical signals. A perfect example is that overbought momentum oscillators can remain overbought for long periods of time. Look at the above chart and the weekly RSI, which remained above 70 almost entirely from late January through early June - yet the advance in technology continued unabated. So don't look at this negative divergence as a signal that technology is guaranteed to drop over the next several weeks. The key takeaway here is that the risk has increased significantly. I use technical analysis to manage risk, not to provide guarantees.
Historical Tendencies
During the month of August over the past 67 years, the S&P 500 has risen 36 times and fallen 31 times. Its annualized return over that period is -1.07% and trails only September (-6.01%) as the worst calendar month for the benchmark U.S. index.
Currently, the S&P 500 is down approximately 1.6% in August 2017.
Key Earnings Reports
(actual vs. estimate):
COTY: .01 vs .09
MDT: 1.12 vs 1.08
TOL: .87 vs .68
(reports after close, estimate provided):
CRM: .09
INTU: (.06)
Key Economic Reports
June FHFA house price index to be released at 9:00am EST: +0.5% (estimate)
Happy trading!
Tom
