Market Recap for Wednesday, September 13, 2017
Wide participation is a key to sustaining a bull market advance. We want as many indices, sectors and stocks on a buy signal as possible. That makes it nearly impossible for bears to regain control of the market as technical buyers show up everywhere. Two days ago, the S&P 500 broke out to an all-time high. Yesterday, it was the Dow Jones and NASDAQ that did the same. The small cap Russell 2000 ($RUT) hasn't yet made its all-time high close, but it's clearly in an uptrend and it's likely only a matter of time before the RUT joins the party:
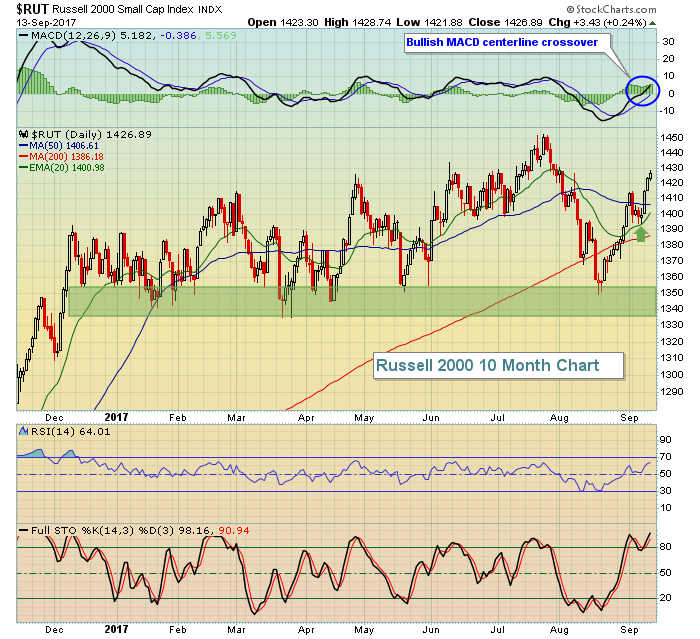 There are a few things to like here. First and foremost, the price support zone (green shaded area) held again during the August selling. Second, the rising 20 day EMA (green arrow) is acting as support during this advance. Finally, that MACD centerline crossover tells us that short-term momentum is accelerating and we should continue to watch for solid support at the 20 day EMA. So despite the fact that the all-time high has yet to be cleared, this small cap index is quite bullish in my view.
Energy (XLE, +1.25%) led the action on Wednesday and this group is clearly beginning to trend higher in the near-term. We had a very interesting discussion regarding the sustainability of the current uptrend in energy during our "Agree or Disagree" segment of MarketWatchers LIVE. Our views of energy were not exactly unanimous, so I'd encourage you to check out the show recording HERE. Our friendly "debate" took place around the 70 minute mark. In this article, I focus a bit more on energy in the Sector/Industry Watch section below.
Significant weakness was felt yesterday in the utilities sector (XLU, -0.49%), adding to the losses from Tuesday. The reason? Utilities normally struggle when treasury yields are rising as their dividends become less attractive relative to those treasury yields. The 10 year treasury yield ($TNX) has risen from 2.03% to 2.20% in just the past four trading sessions.
Pre-Market Action
Crude oil ($WTIC) is up another 1% this morning and it's nearing the psychological $50 per barrel level. Gold ($GOLD) is up slightly as U.S. futures look to pause this morning. Dow Jones futures are down 31 points with a half hour left to today's opening bell.
Current Outlook
While it's always difficult to argue with breakouts to all-time highs, I do try to pay attention to the "under the surface" signals that the market provides us each and every day. As an analogy, think about your automobile. Just because you hop in, start it and drive it to your destination - that doesn't mean the engine's in great shape. You could be right around the corner from a major repair. It's important to maintain your car and let a professional check under the hood once in awhile to make sure all is ok, right? The stock market is much the same way. If you only look at all-time highs as your gauge of market health, you'd have jumped in at the October 2007 high with both feet. But under the surface, there were numerous warning signs as money was pouring into defensive areas to lead that final breakout. Traders need to be taking risks to support breakouts. It's sometimes referred as a "risk on" mentality. When talking about risk here, I'm not referring to traders buying naked options in droves. That kind of insanity can mark tops. What I'm referring to is whether traders are willing to buy stocks in more aggressive areas of the market. My favorite ratio to follow is the XLY:XLP. This tells me how the more aggressive discretionary part of consumer stocks is performing relative to the more defensive staples part of consumer stocks. While this ratio doesn't need to move in lockstep with the benchmark S&P 500, you don't want to see this ratio declining rapidly during an S&P 500 advance. Here's the latest chart of the XLY vs. the XLP:
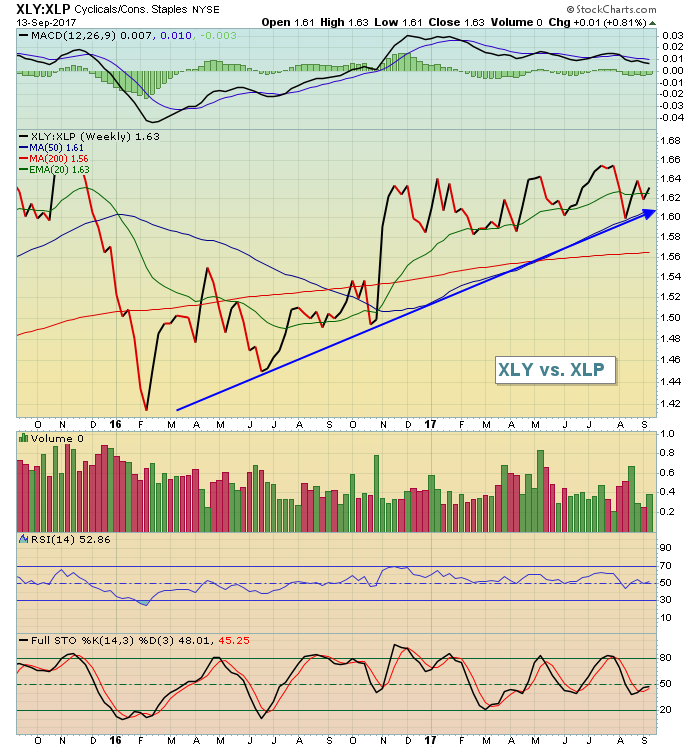 While we haven't broken out to fresh highs in September, we clearly remain in a longer-term relative uptrend and I find that to be supportive of the current bull market.
Sector/Industry Watch
Energy (XLE) has been weak throughout 2017 and that's an understatement. But the group is starting to act much more bullishly as it approaches perhaps the biggest price resistance level on its chart at 67. A breakout above 67 would really change the technical outlook for the sector, in my opinion. I would not be at all surprised to see this run continue to 67 and then back off. What it does from there becomes technically relevant. Here's one possible bottoming pattern that could emerge:
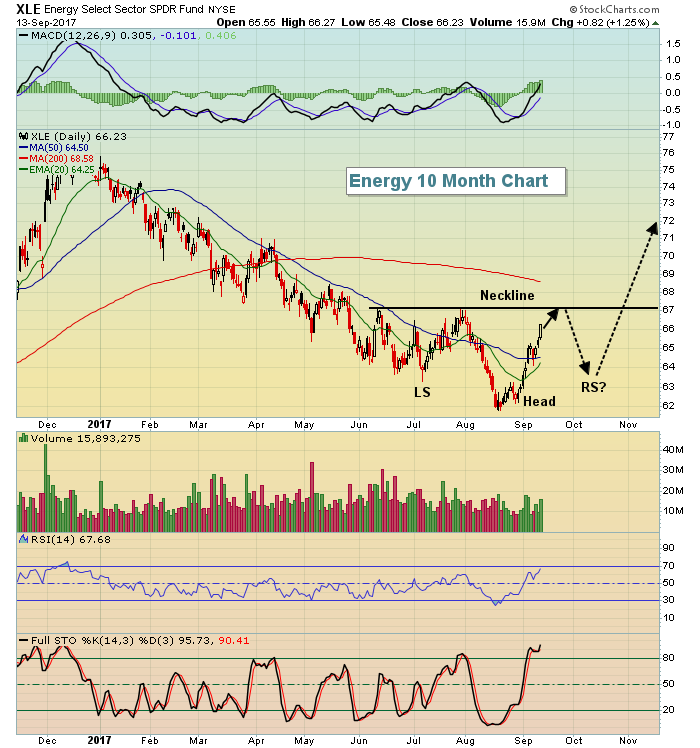 Failure to break above 67 and then losing support near 62 simply continues the downtrend already in place. But the above shows a possible bottoming reverse head & shoulders pattern where 67 becomes the critical level of resistance. While the potential right shoulder has been drawn to symmetrically match the left shoulder low near 63.25, we could see a much more shallow right shoulder that forms as price action tests the rising 20 day EMA. Either way, a breakout above 67 is a game changer in my view. Until that occurs, I'll remain very skeptical of this advance.
Historical Tendencies
I posted this earlier this month, but in case you missed it, here are the annualized returns of the S&P 500 since 1950, broken down by the first and second halves of September:
September 1-15: +4.17%
September 16-30: -15.85%
I wouldn't exactly call the first half of September bullish, but it clearly performs better than the second half - at least historically. The worst week during the second half of September is from the 20th through the 27th. While the current bull market advance could continue through the second half of September, at least be aware of the upcoming bearish historical tendencies.
Key Earnings Reports
None
Key Economic Reports
Initial jobless claims released at 8:30am EST: 284,000 (actual) vs. 302,000 (estimate)
August CPI released at 8:30am EST: +0.4% (actual) vs. +0.3% (estimate)
August Core CPI released at 8:30am EST: +0.2% (actual) vs. +0.2% (estimate)
Happy trading!
Tom
