Market Recap for Tuesday, September 12, 2017
Financials (XLF, +1.18%) were the primary beneficiary on Tuesday as treasury yields rose. That typically leads to strength in this sector, with particular strength usually seen in banks ($DJUSBK) and life insurance ($DJUSIL). Yesterday was no exception and the DJUSBK is featured below in the Sector/Industry Watch section.
Materials (XLB, +0.84%) also were quite strong with aluminum ($DJUSAL) and commodity chemicals ($DJUSCC) leading the way. The latter made a significant breakout above a key level of price resistance just above 470. Take a look:
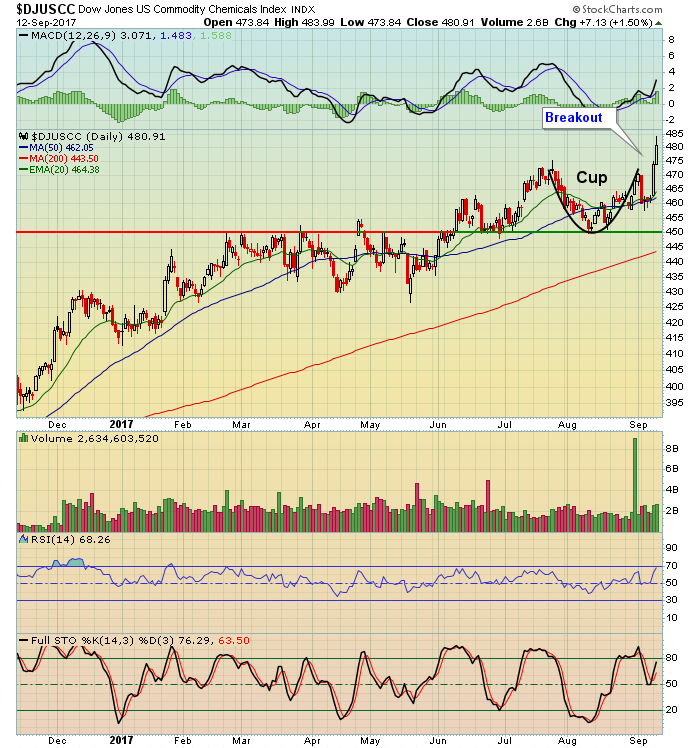 We're seeing a number of industry groups break out to support this latest bull market rally and that's very encouraging. I know we're in the midst of September so profit taking could kick in at any point, but the recent action confirms what I believe will be a strong 4th quarter for U.S. equities.
Utilities (XLU, -1.67%) were under heavy selling pressure on Tuesday as a result of rising treasury yields.
Pre-Market Action
There was no evidence of inflation at the producer level as the August PPI and Core PPI both came in below expectations. In early trading, treasuries have barely budged with the 10 year treasury yield ($TNX) down a half basis point to 2.16%.
U.S. futures are pointing to a slightly lower open as Asian and European markets have been mixed overnight and this morning, respectively.
Current Outlook
The direction of the U.S. Dollar ($USD) tends to follow the difference between U.S. treasury yields and those of foreign countries. Personally, I like to track the difference between U.S. and German yields as there's a very strong positive correlation between the two countries' equity markets. The chart below demonstrates the positive correlation of these two treasury markets and also highlights a potential positive divergence for the USD:
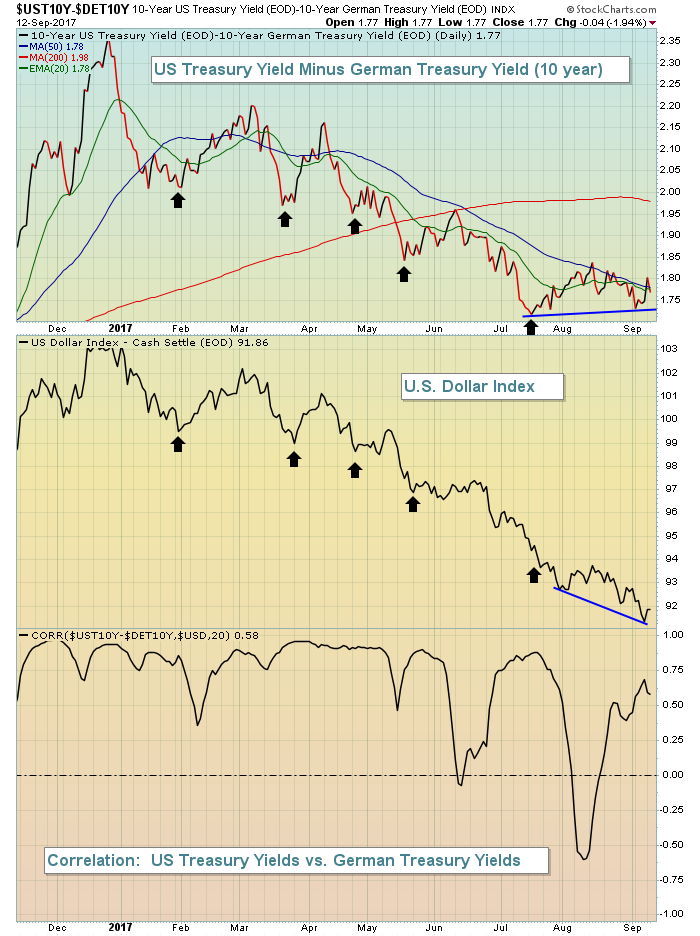 The dollar has continued falling (and gold rising) despite the fact that the U.S. treasury yields seems to have stopped the bleeding vs. the German treasury yields. Is this an indication that the U.S. Dollar will rally? If so, watch the rising 20 week EMA on gold ($GOLD). Momentum in gold is very strong right now and I wouldn't bet against it, but if the long-term bull market in the S&P 500 resumes, I'm not sure that gold will ride higher with it. Therefore, keep a close eye on the relationships above.
Sector/Industry Watch
The suddenly-rising 10 year treasury yield ($TNX) has lit a fire under many financial stocks, particularly banks ($DJUSBK). The selloff of treasuries (and corresponding rise in yields) could not have come at a better time for the DJUSBK. There was a negative divergence present on its weekly chart and the group is close to resetting its MACD at its centerline. Also, we just saw a 50 week SMA test, which I generally look for once a negative divergence has printed. Take a look:
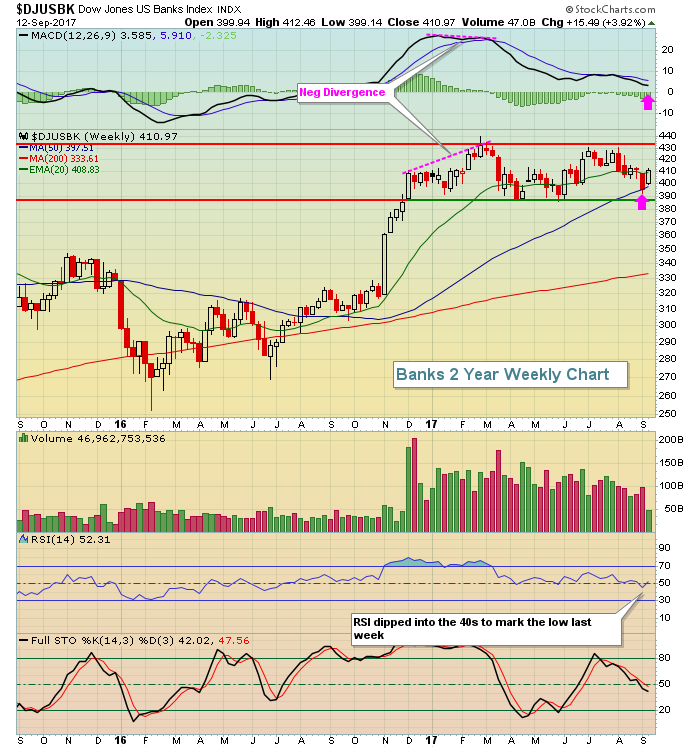 The pink arrows show that the slowing momentum has run its course and now we could see a significant rally from here. Also interesting is the weekly RSI dip into the 40s. If this uptrend is to continue, the RSI 40-50 range needs to hold, as does major price support marked by the April and May lows near 485.
Historical Tendencies
Since 1950, the S&P 500 has performed exceptionally well during the October through January period. Keep in mind that the S&P 500 has averaged gaining 9% per year over the past seven decades. Each of the following calendar months has produced annualized returns in excess of 9% as you can see:
October: +10.85%
November: +18.19%
December: +19.51%
January: +11.57%
So while many market pundits consider the U.S. equity market to be fundamentally overbought, history tells us that we'll likely be higher come the end of January. We do still have to negotiate the second half of September, which has produced annualized returns of -15% over the past 67 years. The worst part of the bearish second half runs from September 20 through September 27.
Key Earnings Reports
None
Key Economic Reports
August PPI released at 8:30am EST: +0.2% (actual) vs. +0.3% (estimate)
August Core PPI released at 8:30am EST: +0.1% (actual) vs. +0.2% (estimate)
Happy trading!
Tom
