Market Recap for Tuesday, September 5, 2017
Hurricane Irma may still be well out in the Atlantic Ocean, but its bearish winds are being felt on the shores of Wall Street already. Irma is a monster and is now regarded as the most powerful Atlantic storm ever recorded and it's on a path to Florida. Property & casualty stocks ($DJUSIP) have taken notice with many selling off big time on Tuesday as the hurricane approaches the United States. This storm, on top of the catastrophic damage from Hurricane Harvey in Texas and recent profit taking in the industry, has sent the DJUSIP plummeting, down 10% over the past month. Check out the chart:
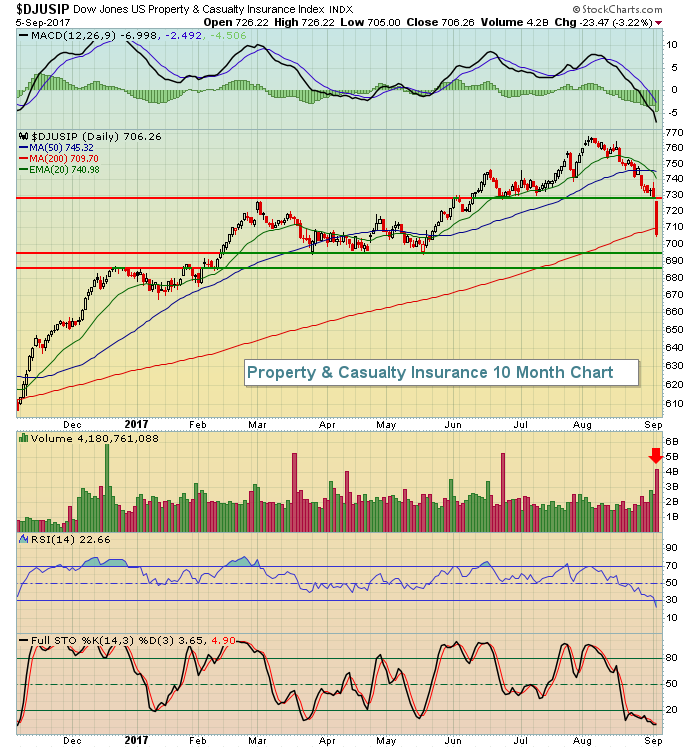 Yesterday's bloodbath was the first technically-damaging selloff, however, with the levy at 730 giving way. Traders are now throwing technical sandbags at the 685-695 for a couple reasons. First, that's a fairly significant trading range of support that dates back to early 2017. Loss of this support area turns a bullish looking chart into a bearish one. The second reason, though, is that the rising 50 week SMA is where I'd also look for support after a negative divergence printed on the weekly chart:
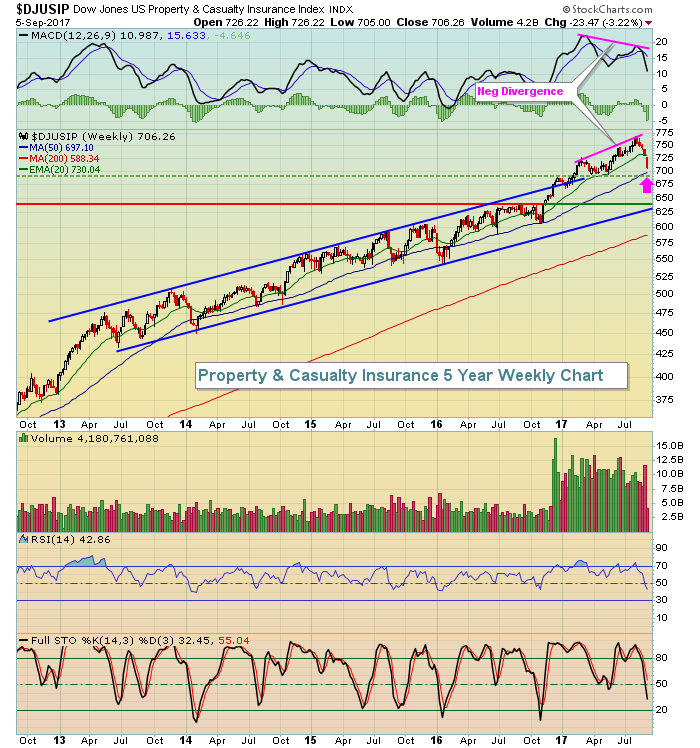 The blue parallel lines above show that the DJUSIP was in a well-defined channel for a few years, just prior to a more parabolic rise in 2017. Momentum began to slow, however, as that negative divergence took hold, and now we see the effects. Some opponents view technical analysis as nothing more than a weather forecast - 50% right and 50% wrong. While I completely disagree with that analogy, the DJUSIP is very likely to move this week based on each weather update regarding Hurricane Irma and its potentially destructive path. Looking at the above weekly chart, if the 685-695 support zone doesn't hold, I believe it'll be a quick trip to 630-640 where price action would meet more significant long-term price support and major trendline support.
The financial sector (XLF, -2.14%) as a whole took the brunt of the selling on Tuesday. Mortgage finance ($DJUSMF) and banks ($DJUSBK) also fell hard on the session. Energy (XLE, +0.55%), utilities (XLU, +0.26%) and consumer staples (XLP, +0.15%) avoided the carnage as more defensive-oriented asset groups benefited on a relative basis. Investors flocked into treasuries on the session - not a good sign for equities.
Pre-Market Action
U.S. futures are ready for a rebound this morning, at least into the early action. Dow Jones futures are higher by 59 points with 30 minutes left to the opening bell. Crude oil ($WTIC) is up more than 1% and back above $49 per barrel.
On the S&P 500, the first test will come at the now-declining 20 hour EMA, currently at 2463. A sustained move through that level would be short-term bullish. Failure at or before that level, however, could lead to more selling.
Current Outlook
The 20+ Treasury Bond ETF (TLT) broke to a 2017 high in very bullish fashion and that suggests that traders are quite cautious regarding economic growth during the balance of 2017 and into 2018. Investors have a choice whether to invest their dollars in bonds or equities and recent developments indicate that bonds are winning. Here's the latest weekly chart on the TLT:
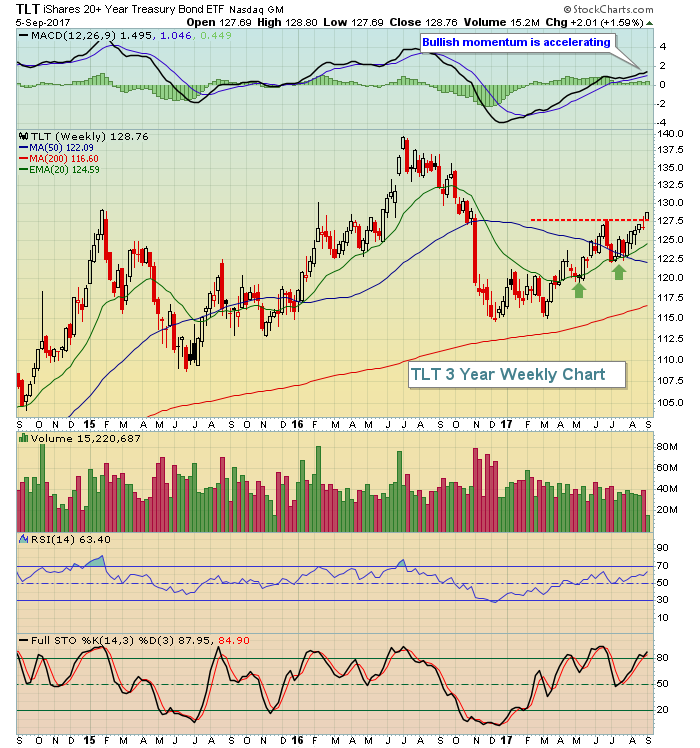 The green arrows show that the rising 20 week EMA has been excellent support and that's what we typically see during uptrends. On Tuesday, the TLT broke out above 2017 highs and the weekly MACD is accelerating to the upside. The story here is that traders are pouring into treasuries and that should be viewed not-so-bullishly for equities, especially given that we're in the worst calendar month of the year historically for equities (September).
Sector/Industry Watch
Over the past week, gambling stocks ($DJUSCA) have gained more than any other industry group in consumer discretionary, rising 3.76% despite the S&P 500 gaining less than 1%. The DJUSCA remains one of the best looking charts technically and we could be seeing a very bullish inverse head & shoulders pattern printing that could lead to another 10% move higher based on pattern measurement. Here's the chart:
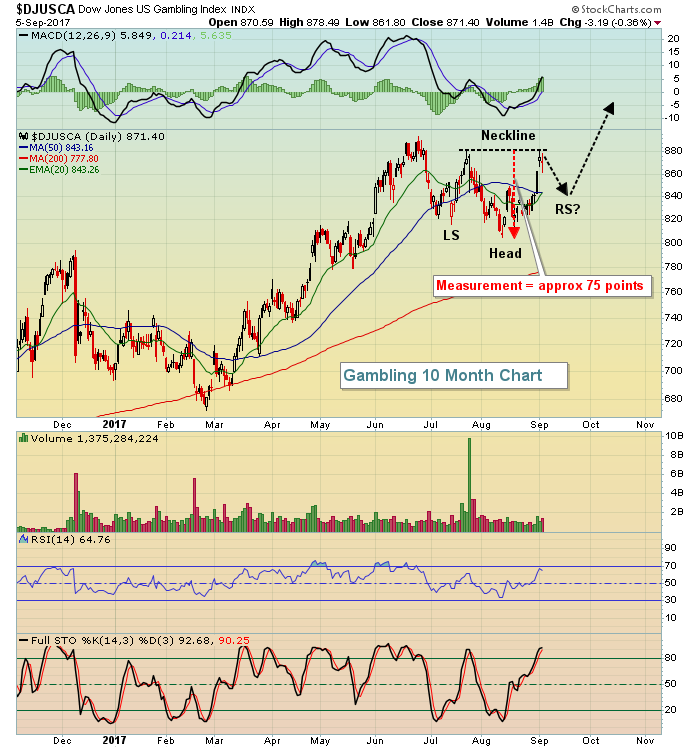 A pullback in the group to establish the inverse right shoulder could provide an excellent setup into a stock like Wynn Resorts (WYNN). WYNN broke out above triple top resistance on Friday and a pullback there to its rising 20 day EMA would represent solid entry as a possible trading candidate to ride the gambling wave.
Historical Tendencies
The following represents the breakdown of S&P 500 performance during September over the past 67 years:
September 1-15: +4.17%
September 16-30: -15.85%
Clearly, the bearish bias in September is primarily contained in the second half of the month. Therefore, if we see breakdowns technically during the first half of September, I'd look for accelerated selling in the second half.
Key Earnings Reports
None
Key Economic Reports
August PMI services to be released at 9:45am EST: 56.9 (estimate)
August ISM non-manufacturing index to be released at 10:00am EST: 55.8 (estimate)
Beige book will be released at 2pm EST
Happy trading!
Tom
