Market Recap for Wednesday, November 15, 2017
Eight of nine sectors lost ground on Wednesday and while that, along with a couple major indices closing beneath their respective 20 day EMAs, might be cause for concern, I actually thought much of the action was bullish. First and foremost, the tech-heavy NASDAQ was able to rally enough in the afternoon to end with a kick save, printing a reversing candle in the process:
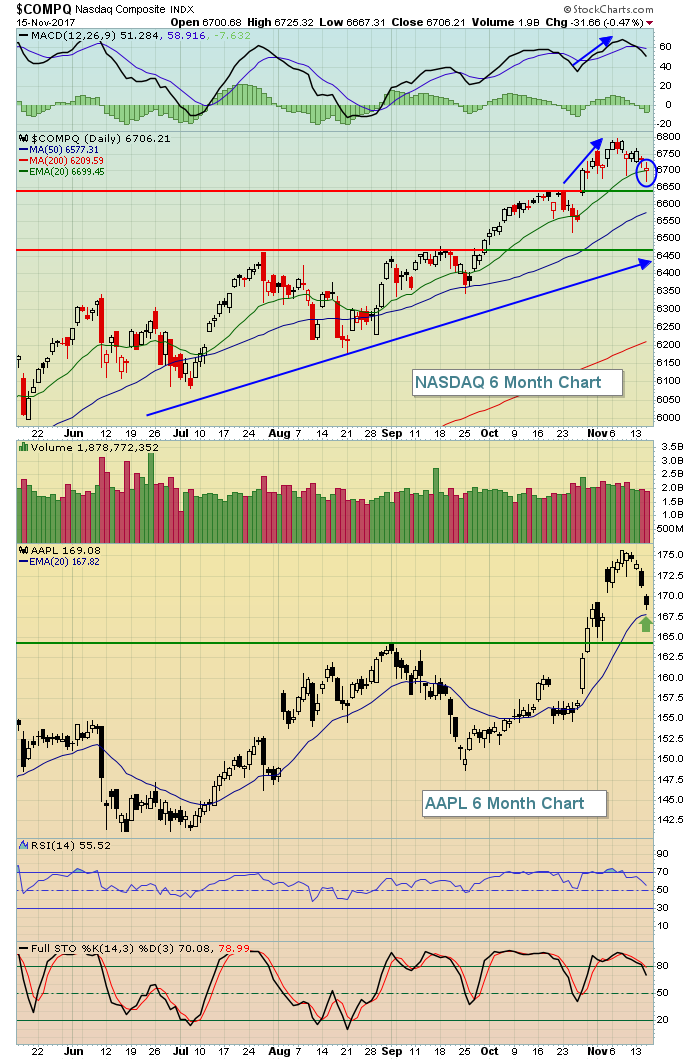 The candle that formed yesterday on the NASDAQ is a doji, a short-term reversing candle that suggests indecision on the part of traders. Many times, following a downtrend, a doji will print and mark a short-term bottom. The fact that it occurred on the key rising 20 day EMA - with a MACD printing a fresh high to accompany the last price high - tells me we're, more likely than not, set to rally from here to test the recent price high.
Yesterday's weakness was consistent across many sectors, but energy (XLE, -1.13%), consumer staples (XLP, -1.06%), utilities (XLU, -0.86%), and technology (XLK, -0.74%) were the primary laggards. The XLE did lose both its 20 day and 50 day moving averages during this recent bout of profit taking. I'll be watching the recent low candle body at 66.87 for price support. I don't want to see the XLE close beneath that level. The XLU and XLP both had been quite strong lately so short-term selling in those areas really are not much of a concern at this point. The XLK struggled as computer hardware (includes AAPL) led technology to the downside. I've featured AAPL in the NASDAQ chart above to show the recent weakness in that leader as it approaches a key rising 20 day EMA support level. All is still fine technically with AAPL and I'd expect to see a return to recent price highs.
The one very bullish development yesterday was the strength in financial stocks (XLF, +0.27%), especially banks ($DJUSBK, +0.53%) and life insurance ($DJUSIL, +0.16%). While those percentage gains may not look like much, financial stocks opened significantly lower yesterday, with the XLF clearing 50 day SMA support with the weak open. It could have turned very ugly for financials. Instead, we saw a significant recovery and even gains on the day, suggesting a bottom is in on a very influential area of the stock market. I feature the XLF chart below in the Sector/Industry Watch section.
Pre-Market Action
Futures are strong this morning on the heels of a very solid quarterly earnings report from Cisco Systems (CSCO) after the bell on Wednesday. Network Appliance (NTAP) also soared after releasing its better-than-expected results. This morning, it was Wal-Mart's (WMT) turn and they too crushed expectations. This trifecta certainly is providing a much-needed boost to U.S. indices in pre-market trade.
With 30 minutes left before the opening bell, Dow Jones futures are higher by 72 points.
Current Outlook
Today's headline sounds more bearish than it really is. Yes, the Dow Jones and S&P 500 both lost their rising 20 day EMAs and it's the first time that both have closed beneath that key moving average since late August, or nearly three months. But....it could have been much worse. The NASDAQ was also beneath its 20 day EMA, but rallied to close back above it and a big reversal in the Volatility Index ($VIX) suggests we may have just witnessed a near-term bottom in the U.S. market:
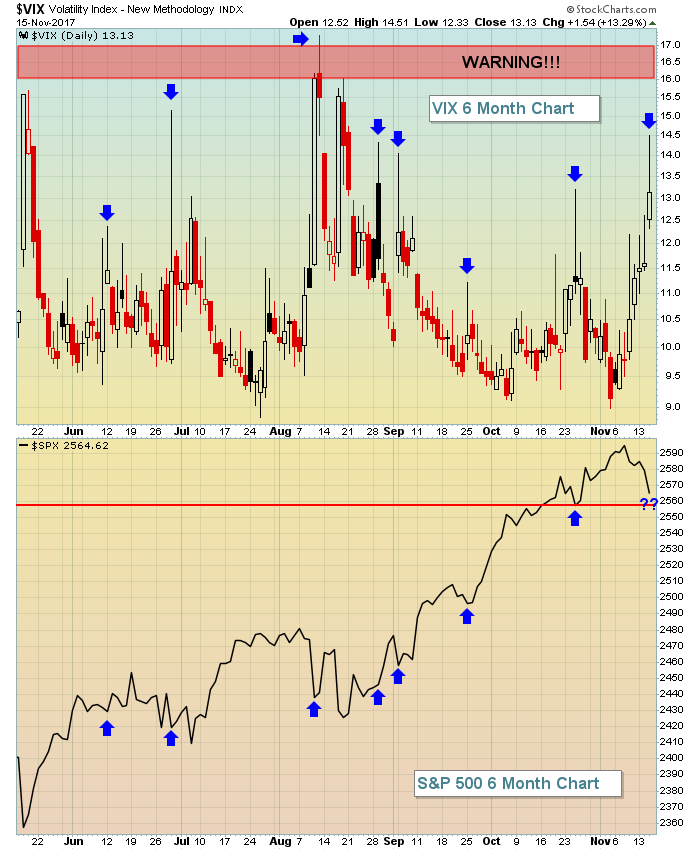 The blue arrows highlight a number of key VIX tops and they mostly coincide with key S&P 500 lows - in the near-term. That's what happens during bull markets. We see periods of declining prices that are underscored by rising tension - only to reverse as jitters settle back down and the stock market resumes its prior advance. The red highlighted area provides a very critical area because both of the last two bear markets began with a VIX reading above this 16-17 zone. So one thing we need to watch for is not only a VIX trip above 16-17, but consistent closes above that level - even as the S&P 500 tries to advance one final fateful time. That provides us the sentiment signal that bear market conditions are present.
Sector/Industry Watch
Financials were a shining star in an otherwise dark day for Wall Street. The XLF had recently printed a negative divergence, a sign of slowing price momentum, and these divergences typically result in deeper selling to unwind that slowing momentum. It's not at all unusual to see rising 20 day EMAs hold as support as price momentum accelerates to the upside....and then fail with the negative divergence printing. The XLF provides us with a perfect example of how this works:
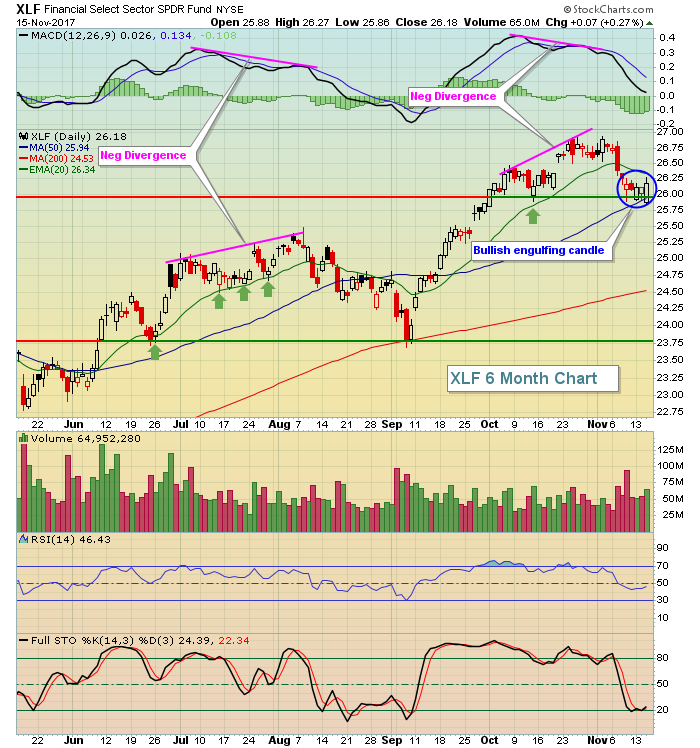 The green arrows mark successful 20 day EMA tests while the MACD is rising. But do you notice that the rising 20 day EMA loses its magic after a negative divergence prints? As the XLF moves to those highs, the negative divergences warn us of elevated risk - not a guarantee of lower prices. This is important because those who do not believe in technical analysis will point to failures as reasons why TA doesn't work. Failures are part of the game. The key here is that technical analysis warns of heightened risk and risk management is critical to any trader's trading success.
Historical Tendencies
Check out the historical tendency of the VIX:
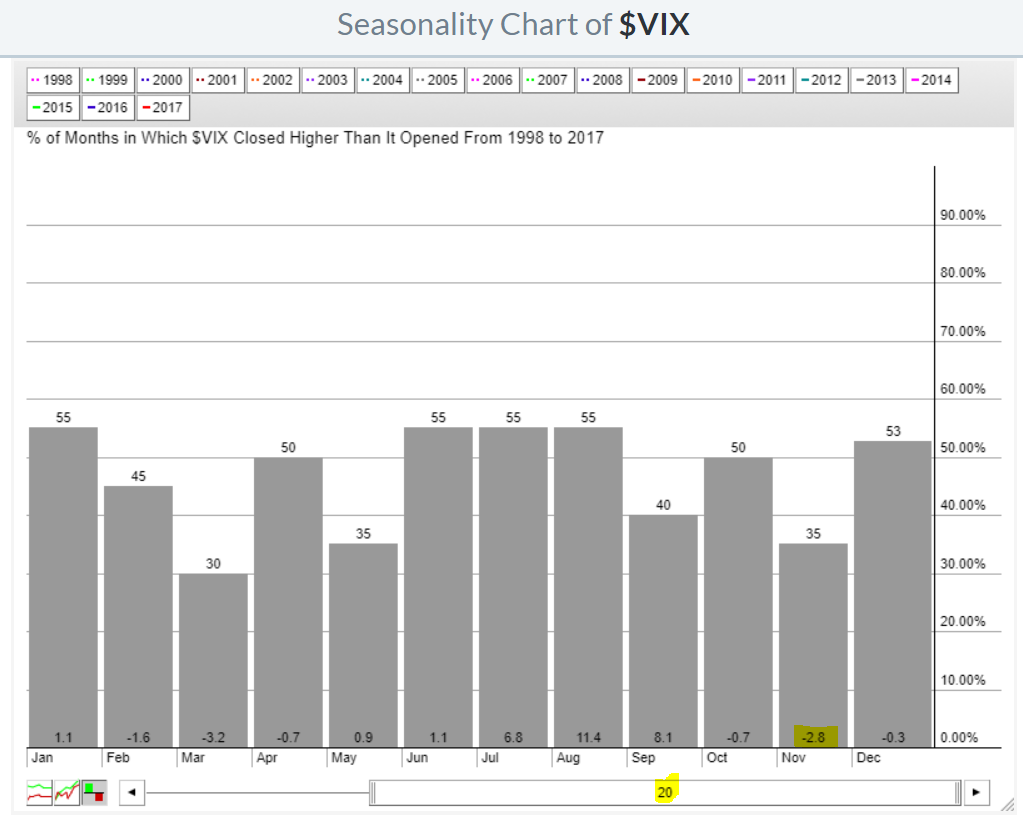 Note that the VIX performs poorly in the fourth quarter, especially during November. The reason? The VIX declines when the stock market rises and the October through December period is historically bullish.
Key Earnings Reports
(actual vs. estimate):
BBY: .78 vs .79
SJM: 2.02 vs 1.89
WMT: 1.00 vs .97
(reports after close, estimate provided):
AMAT: .91
ROST: .67
Key Economic Reports
Initial jobless claims released at 8:30am EST: 249,000 (actual) vs. 236,000 (estimate)
November Philadelphia Fed business outlook survey released at 8:30am EST: 22.7 (actual) vs. 25.0 (estimate)
October industrial production to be released at 9:15am EST: +0.5% (estimate)
October capacity utilization to be released at 9:15am EST: 76.3% (estimate)
November housing market index to be released at 10:00am EST: 67 (estimate)
Happy trading!
Tom
