Market Recap for Monday, December 11, 2017
The Russell 2000 remained in true December form as it continues to struggle during the first half of the month, despite records being set on both the Dow Jones and S&P 500 on a daily basis. It truly is an anomaly. Since 1987, the Russell 2000 has moved higher 170 times during the first half of December, while losing ground 158 times. So there's roughly been a 51.8% chance of small caps rising on any given day during the December 1-15 period. But consider the second half of December where small caps have risen 64.9% of the time. The good news for small cap investors is that we're nearly done with the first half of December. And the best news is that the technical outlook for small caps remains quite strong:
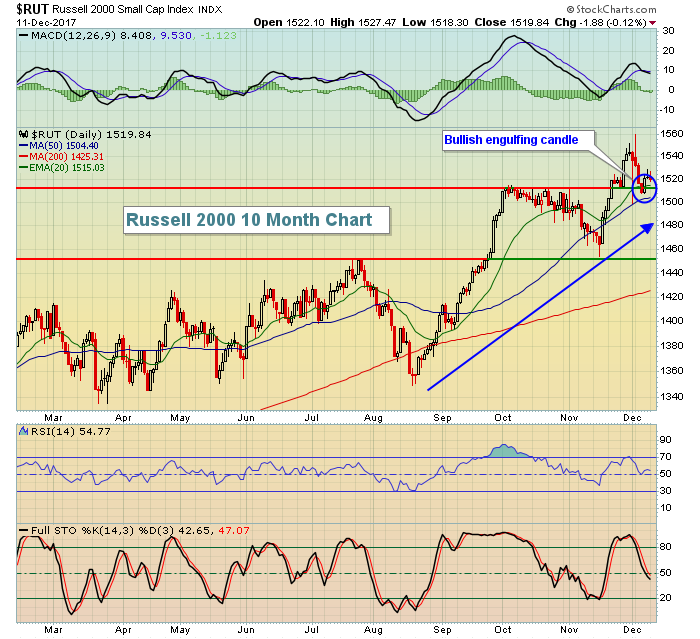 I expect we're at or near a time where we'll begin to see small caps accelerate. The Dow Jones and S&P 500 gained 0.23% and 0.32%, respectively, to set all-time record high closes once again. The NASDAQ had a solid day, climbing 0.51%. Technology (XLK, +0.86%) was the clear winner on the day, although energy (XLE, +0.72%) rallied to near another breakout:
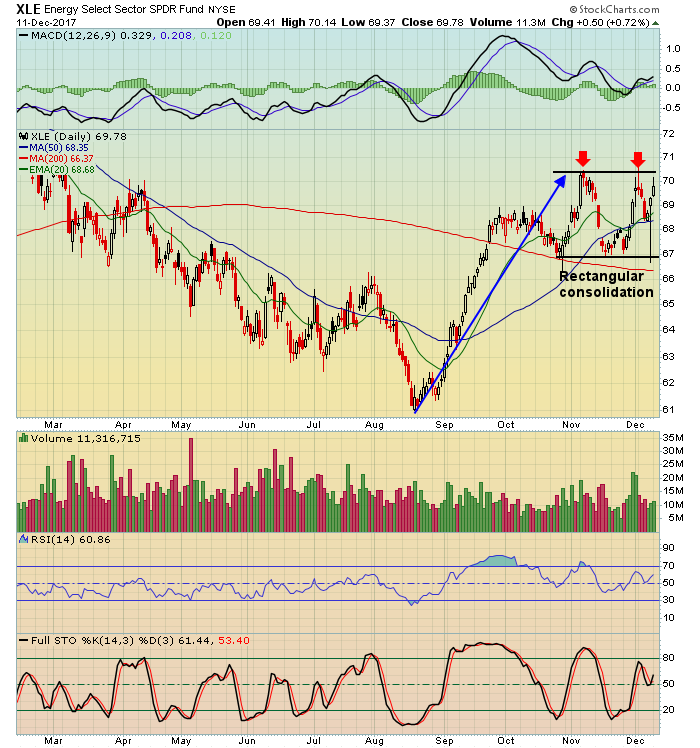 A close above 70.50 would be bullish for the XLE and energy stocks in general.
The 10 year treasury yield ($TNX) started the day off rather slowly yesterday and that curbed enthusiasm for both financials (XLF, -0.25%) and industrials (XLI, -0.20%), despite the fact that early TNX losses were mostly erased by day's end.
Pre-Market Action
The first thing that jumps out at me is the TNX rising to reach 2.40% on a day where the FOMC meeting begins. I'm expecting to see higher rates down the road for two reasons. First, based on the performance of many areas of the market, especially banks ($DJUSBK), railroads ($DJUSRR) and small caps ($RUT), it appears the market is suggesting improving economic conditions ahead. That alone will cause many to sell treasuries, sending the yield higher. But also keep in mind that the Fed has a ton of treasuries on its balance sheet that they've already announced will be sold in the coming months. How much and how fast are two key considerations that will impact treasury prices and Fed Chair Janet Yellen will likely shed more light on that with the FOMC announcement tomorrow at 2pm EST.
Asian stocks were mostly lower overnight, while European stocks are currently printing fractional gains. Gold ($GOLD) is down another 3 bucks and appears headed down to test price support in the 1200-1210 area. At last check, GOLD was at 1244.
With just 30 minutes left to the opening bell, Dow Jones futures are up by 50 points.
Current Outlook
Divergences on the 60 minute charts remain bullish on the S&P 500 and suggest that any short-term selling is likely to be contained. Check out the current status of the S&P 500's 60 minute divergence:
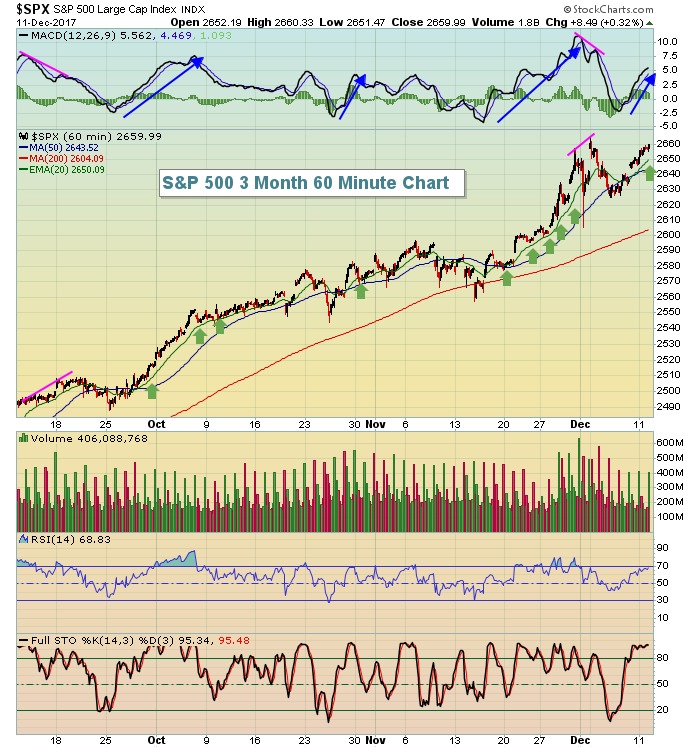 Over the past three months, the pink lines highlight slowing momentum issues and they've been followed with deeper selling. But when the price momentum is strong (blue directional lines), note that the rising 20 hour EMA provides excellent support. Currently, we're in a period of accelerating bullish price momentum. I'd expect any pullbacks to be brief.
Sector/Industry Watch
A low Volatility Index ($VIX) reading makes many traders nervous because they believe extreme complacency suggests a market top. I beg to differ. I LOVE low volatility readings. The VIX is calculated to measure the S&P's expected volatility based on the pricing of certain S&P options that expire in 1-2 months. Low volatility is associated with dull, boring bull markets while consistent, elevated volatility is most closely correlated with bear markets. For the fourth time in 2017, we saw the VIX close beneath 9.50 with a finish of 9.34 on Monday. Here are the previous VIX closes beneath 9.50 and subsequent two month S&P 500 gains in parenthesis:
July 21st: 9.36 (+1.17%)
October 5th: 9.19 (+3.06%)
November 3rd: 9.14 (+2.78% over last 5 weeks)
December 11th: 9.34 (time will tell)
Furthermore, the chart below shows a long-term chart of the S&P 500 (with the VIX readings below) and each of the last two bear markets started and lasted in its entirety with a VIX above 16-17:
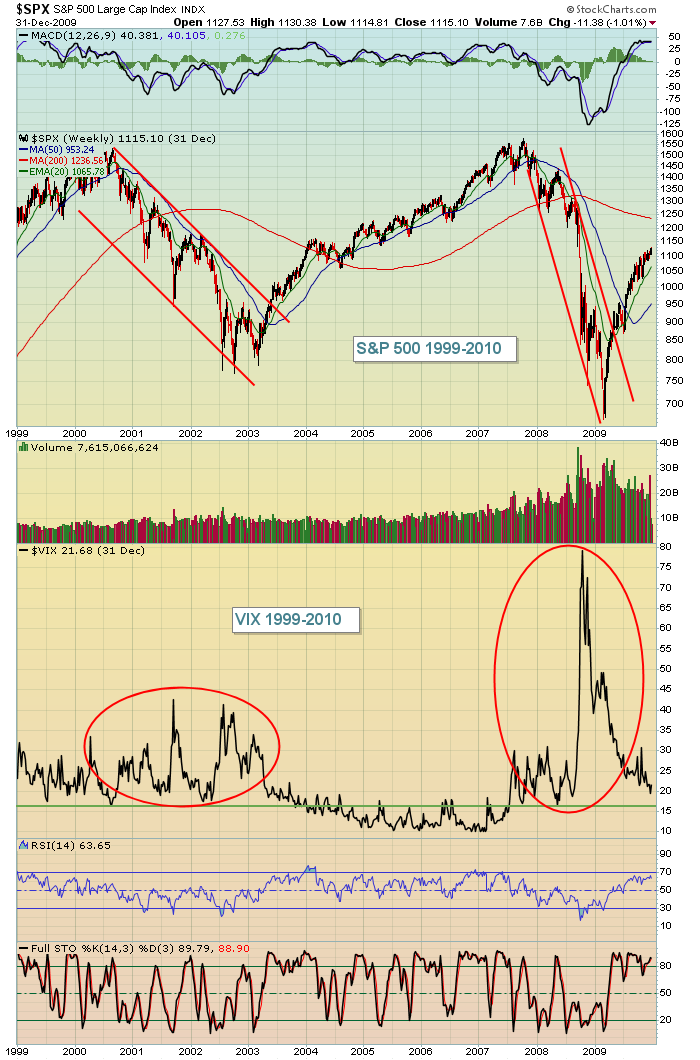 Those were the last two bear markets and you can see that the VIX wasn't below 10 when they began. VIX was already elevated above 16 at the time the bear markets started and they remained above 16 throughout the entire bear markets. Bear markets require certain conditions to exist, much like tornadoes. A bear market doesn't develop out of clear blue bull market skies.
A rising VIX is what we should look for at market tops, not a VIX at record lows. A rising VIX suggests nervousness on the part of traders as money rotates toward defensive areas and that's exactly the type of market environment where bear markets begin. I remain firmly bullish to close out 2017 and begin 2018.
Historical Tendencies
Yesterday, I provided historical facts showing that the Russell 2000 performs much, much better in the second half of December vs. the first half. Below is a breakdown on the S&P 500 (annualized returns since 1950):
December 1-15: +2.60%
December 16-31: +37.88%
So while the S&P 500 continues to find reasons to close at all-time highs, history tells us the best part of December is yet to come.
Key Earnings Reports
None
Key Economic Reports
November PPI released at 8:30am EST: +0.4% (actual) vs. +0.3% (estimate)
November Core PPI released at 8:30am EST: +0.3% (actual) vs. +0.2% (estimate)
FOMC meeting begins today and ends with policy statement at 2pm EST on Wednesday
Happy trading!
Tom
