Market Recap for Thursday, January 18, 2018
Thursday was not a great day for the bulls. We haven't seen too many times since the August low where all of our major indices finished lower on the session. Yesterday, however, was one of those days. But the action recently in the gambling index ($DJUSCA) perfectly illustrates how you can find trading gems in the market despite wildly overbought market conditions. Take a look at the DJUSCA chart:
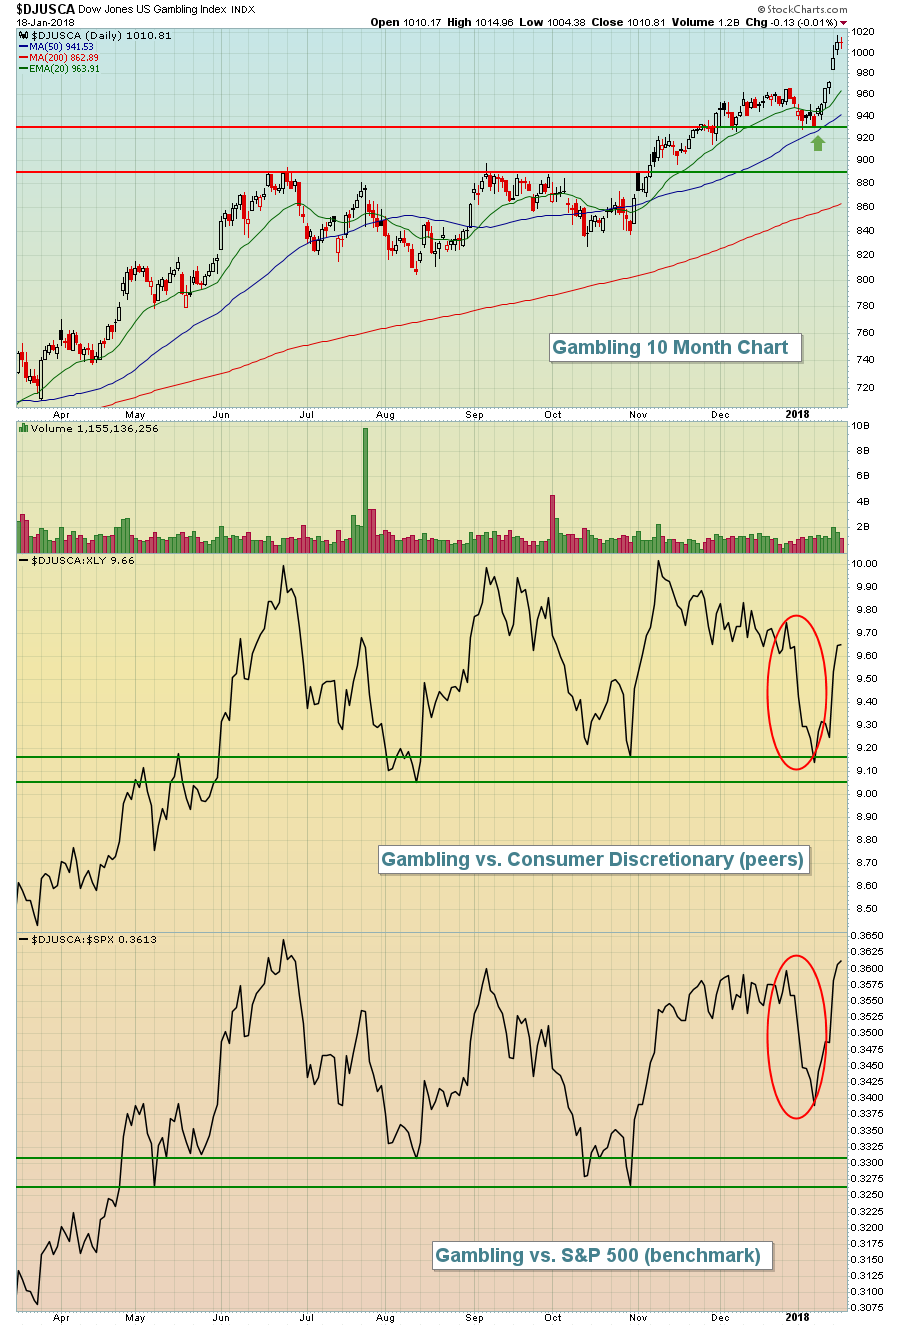 Gambling stocks have been one of the leaders over the past week, but check out how this group opened 2018 - while the overall market was exploding higher. The DJUSCA did not participate on an absolute basis and certainly didn't on a relative basis (red ovals above). But, for those astute traders interested, gambling stocks provided an excellent reward to risk entry because of that weakness. Melco Resorts & Entertainment (MLCO) bounced beautifully off price and trendline support near 27.00 to rise above 29.00 at Thursday's close. That's a major three day advance in a group that was probably being overlooked by many. The reward to risk was quite solid, however, and was one of the trade setups I provided prior to this week. To make sure you check these setups out each week, subscribe to my blog at the bottom of my article. Simply type your email address into the box provided and click the green "Subscribe" button. Prior week's trade setups are also included. Feel free to check out how those have performed.
Technology (XLK, +0.18%) was the only sector to post much of a gain yesterday, while energy (XLE, -0.82%) and utilities (XLU, -0.63%) took the brunt of the selling.
Pre-Market Action
We're seeing global gains overnight in Asia and this morning in Europe. But sign in the U.S. thus far are pointing to a pause. With 30 minutes left to the opening bell, Dow Jones futures are down 8 points.
The 10 year treasury yield ($TNX) continues to bang against serious overhead yield resistance in the 2.60%-2.62% range. Currently, the TNX sits at 2.62%. This is very significant as a breakout would indicate more short-term selling of treasuries, the proceeds of which typically wind up in equities.
Current Outlook
Entering positions in a raging bull market can be quite scary. Who wants to be the last dollar in? But you need to keep in mind that even as the market sells off, there'll be pockets of strength. Those who are selling red hot sectors and industry groups will look to reinvest in areas of the market that also are strong from an intermediate- to long-term perspective, but not participating recently. If everything sold at the same time, we'd see the Dow Jones lose 1000 points in a trading session....and the S&P 500 might tumble 100 points. I don't see that type of selling on the horizon. Instead, I look to buy into areas that have pulled back recently to key support levels.
One such area is renewable energy ($DWCREE). This industry group was the strongest group in 2017, but it's fallen 7-8% in the past week and is now testing its 20 day EMA. Please understand that renewable energy is an extremely volatile group, so it's not for everyone. But the reward to risk is much better on the industry now than it was one week ago. That much is indisputable in my opinion. Check out the pullback:
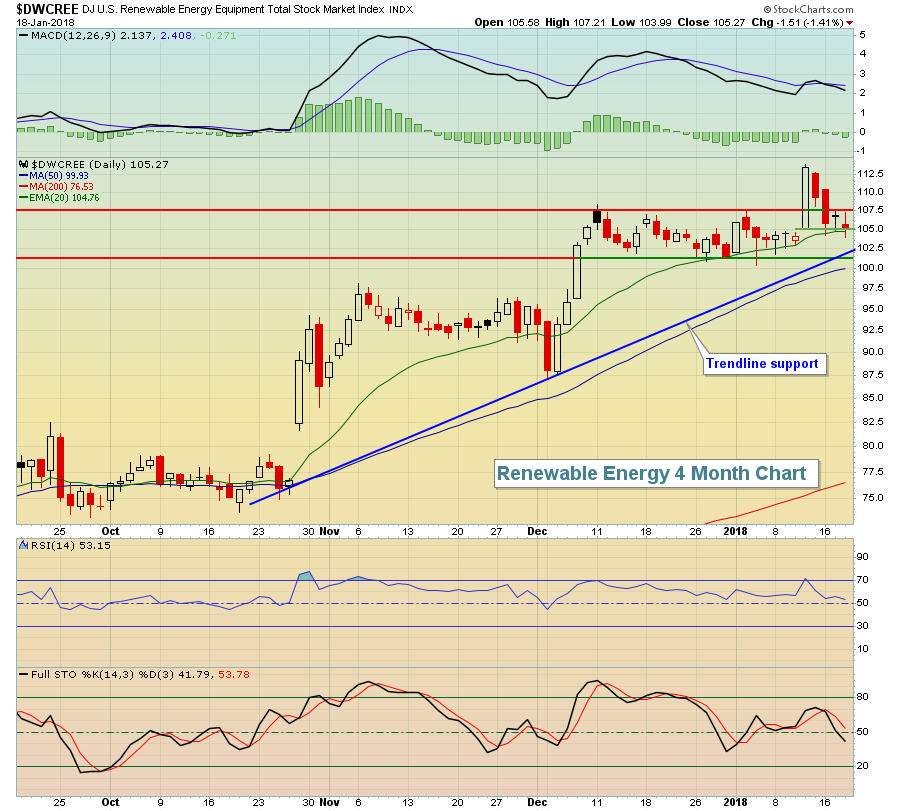 While most industry groups have climbed over the past week, there have been notable exceptions. Renewable energy (chart above) is one, but there are others. Automobiles ($DJUSAU) are in a very bullish longer-term pattern, but have dropped 2.48% over the past week. Brewers ($DJUSDB) came to life over the past 6-7 weeks, but have struggled much of this week with a key test of support fast approaching (see Sector/Industry Watch below for more details).
A bull market in the major indices makes it difficult psychologically to take the plunge and invest new money, but just keep in mind that even during the strongest bull market runs, there'll be sector and/or industry pullbacks and relative weakness to allow you high reward to risk entries.
Sector/Industry Watch
The Dow Jones U.S. Brewers Index ($DJUSDB) sprung to life and recently cleared its downtrending 20 week EMA. That can be an initial sign of a big advance ahead. However, I want to see that 20 week EMA hold as support on pullbacks to provide me the confidence to stick with that theory of higher prices ahead. So check out this weekly chart:
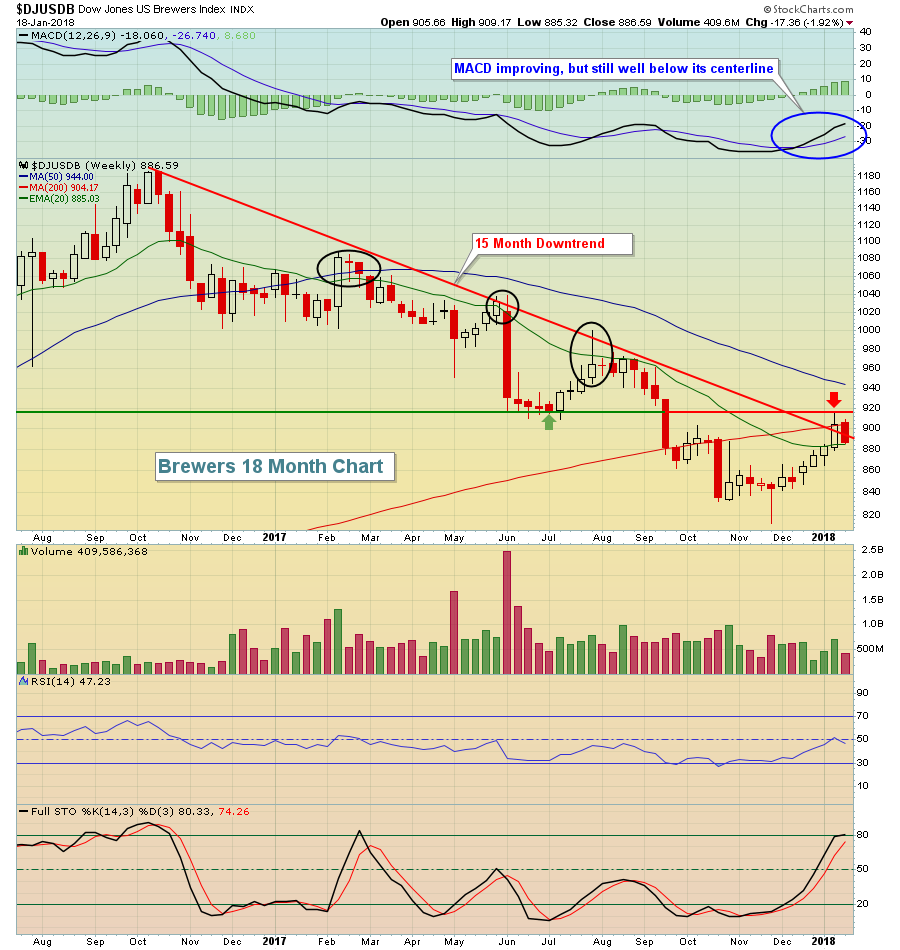 Throughout this downtrend, the weekly RSI has remained below 60 and it's still below 60 (currently at 47). You can also see that the DJUSDB challenged overhead price resistance last week near 920 and failed. So while the group was able to climb above both its 15 month downtrend line AND its declining 20 week EMA - two necessary components to begin an uptrend - we still don't have confirmation in our other technical signals that a reversal has taken place. In my opinion, holding the now-rising 20 week EMA and breaking above 920 on a weekly basis is what's needed to really change the technical outlook for brewers.
Historical Tendencies
Yesterday, I discussed that the S&P 500's bullish period that began at the close on October 27th ended on January 18th. The NASDAQ's history suggests that January 19th (today) is the end of its bullish period. January 20th through the 25th definitely takes on a different character historically, however. Check out the following very distinctive periods (annualized returns followed by odds of an up day in parenthesis):
January 2nd-19th: +23.26% (59.75%)
January 20th-25th: -14.80% (50.52%)
January 26th-February 6th: +30.09%, (61.58%)
The 20th through the 25th represents a clear historical dropoff in performance and the NASDAQ certainly could use a breather. The purpose of this discussion is not to say I'm predicting selling next week. Rather, just be aware that any bull market pause in the upcoming week should be considered normal from a seasonal perspective.
Key Earnings Reports
(actual vs. estimate):
CFG: .71 vs .67
RF: .27 vs .26
SLB: .48 vs .44
STI: 1.09 vs 1.05
SYF: .70 vs .63
WIT: .06 vs .06
Key Economic Reports
January consumer sentiment to be released at 10:00am EST: 97.0 (estimate)
Happy trading!
Tom
