Market Recap for Thursday, February 1, 2018
We saw a lot of bifurcation in the market on Thursday. The more aggressive NASDAQ and Russell 2000 rebounded and finished in positive territory, while both the Dow Jones and S&P 500 fell on the session. Four sectors finished higher, while five retreated.
Among the winners on Thursday, energy (XLE, +1.03%) rebounded after closing beneath its 20 day EMA the previous two days. It was the first time we've seen the XLE close below its 20 day EMA on consecutive days since late November. Financials (XLF, +0.94%) also surged on the heels of the rising 10 year treasury yield ($TNX), which closed at another 3 1/2 year high. The TNX is surging once again in pre-market action so I'd expect to see money continue to rotate towards financials.
Investment services ($DJUSSB) rose another 2% yesterday to close at another recent high and testing its highs just before the 2007 bear market began. Check out this long-term chart:
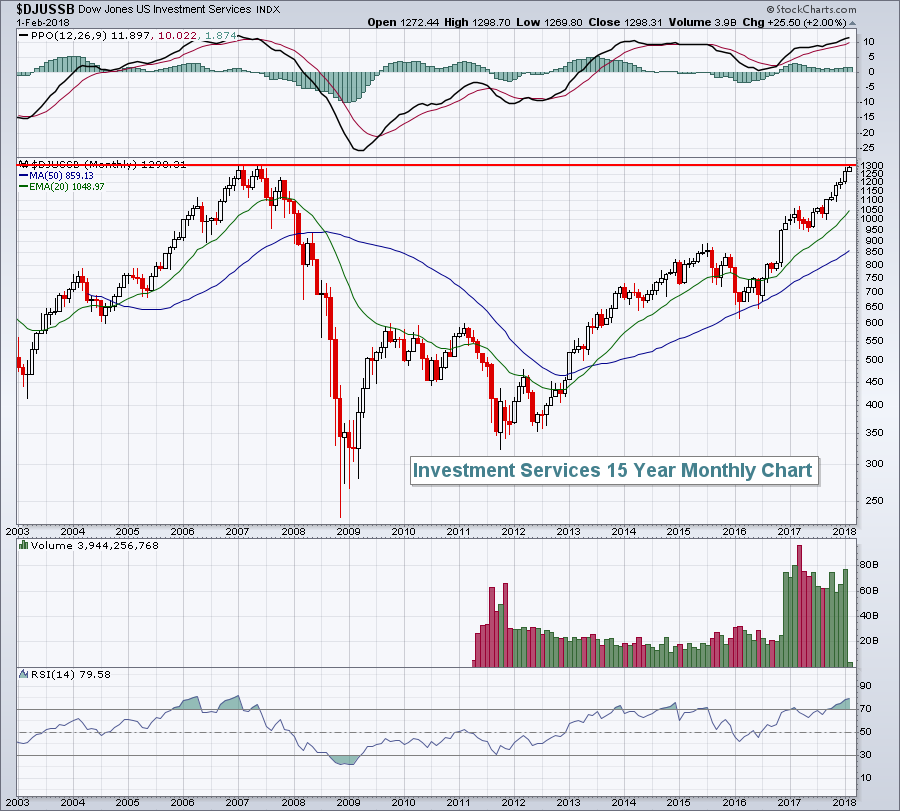 Monthly RSI is extremely overbought and the DJUSSB is hitting major long-term resistance, so we'd expect to see a pause here. However, a rapidly rising TNX is aiding this group, along with many other financials, and if the uptrend in the TNX continues, the DJUSSB may not be ready to pause just yet.
As you might expect, the rising TNX has a negative impact on utilities (XLU, -1.57%), the worst performing sector on the day.
Pre-Market Action
There were several BIG earnings reports after the bell on Thursday and we're seeing mixed reviews from traders in pre-market action. Apple (AAPL) is basically flat, while Amazon.com (AMZN) is surging. Alphabet (GOOGL) and Amgen (AMGN) are down 3.5% and 2.0%, respectively.
The January nonfarm payrolls report came in above expectations, just as the ADP employment report suggested on Wednesday morning. Accordingly, the 10 year treasury yield ($TNX) has shot higher this morning, up another six basis points to 2.83% on the report. There's a ton of selling taking place in the bond market right now. It'll be interesting to see if this bond selloff results in a significant rebound in equities today.
Currently, Dow Jones futures are lower by 233 points with 45 minutes left to the opening bell.
Current Outlook
Let's take a look at the gold miners (GDX). Since mid-December, the GDX is up approximately 10% and seems like a great place to invest. But I'm still not sold on the group as I'm constantly trying to outperform the benchmark S&P 500. Being in an uptrend and being a great relative performer can be two very different things and I'll illustrate that now.
First, let's look at the absolute performance of the GDX on a 1 year chart:
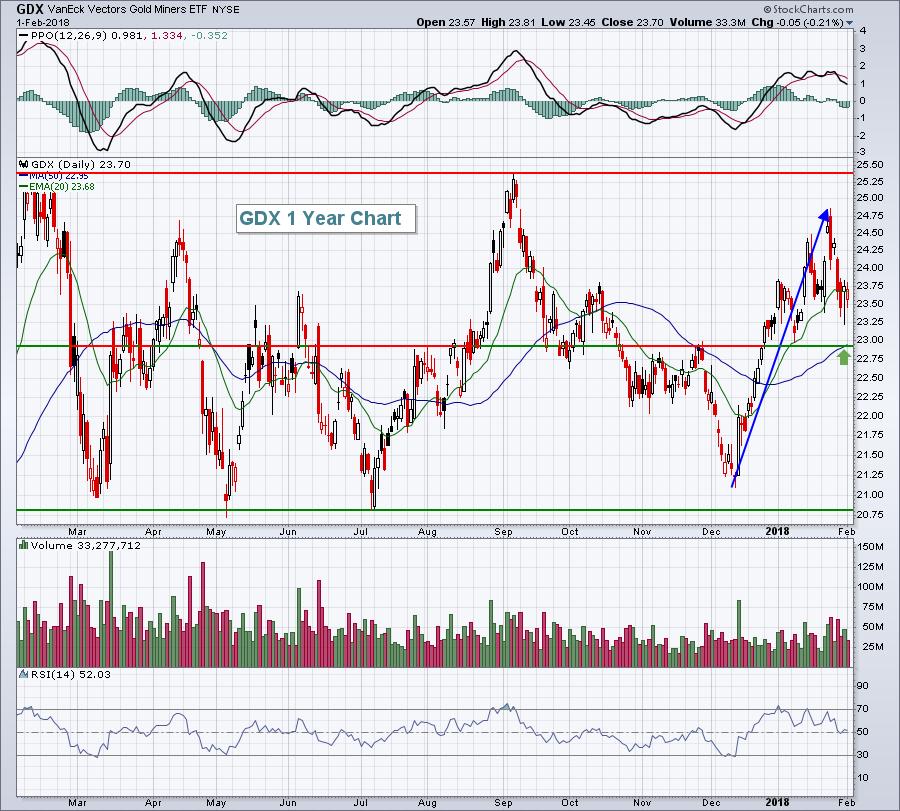 The blue directional line highlights the recent strength of gold miners, but the 1 year chart shows that prior rally attempts have not been sustained. The green arrow above marks the combination of price support and the rising 50 day SMA. I'd very cautious if this level fails to hold as support. But perhaps more importantly, the GDX simply hasn't been a solid investment, when compared to the benchmark S&P 500 for more than 6 years.
Here's a longer-term look at relative performance:
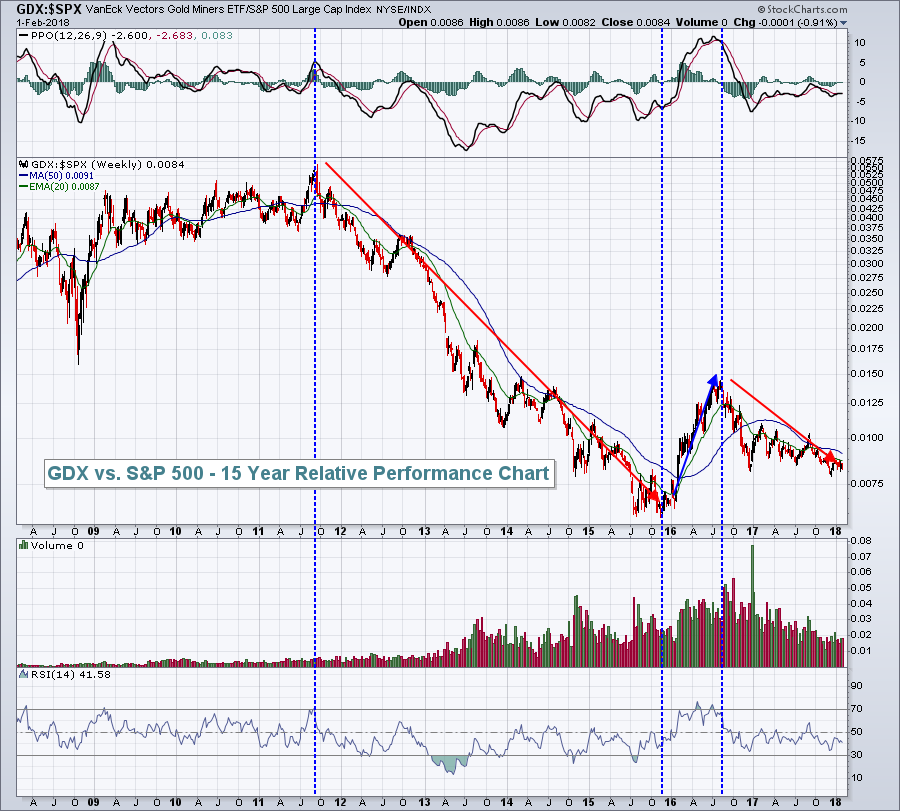 Since 2011 Q3, the GDX has consistently underperformed the S&P 500. We saw one blip in this relative downtrend, during a 9 month relative strength period that ended in Q3 of 2016. But why try to outperform the S&P 500 by investing in the GDX? It makes no sense to me.....yet.
One final thought. The U.S. Dollar Index ($USD) has been in steady decline since December 2016. A falling dollar typically lifts gold ($GOLD) and its miners (GDX). If the GDX cannot outperform the S&P 500 during a 13 month period where the USD has fallen from 104 to 88, when will it outperform?
Just say NO to gold and the miners.
Sector/Industry Watch:
The energy sector (XLE), like many sectors, has printed a negative divergence on its daily chart, suggesting the odds of a PPO centerline test and/or 50 day SMA test have increased considerably. Currently, that 50 day SMA resides at 72.25. Keep that level in mind as we look at the longer-term weekly chart:
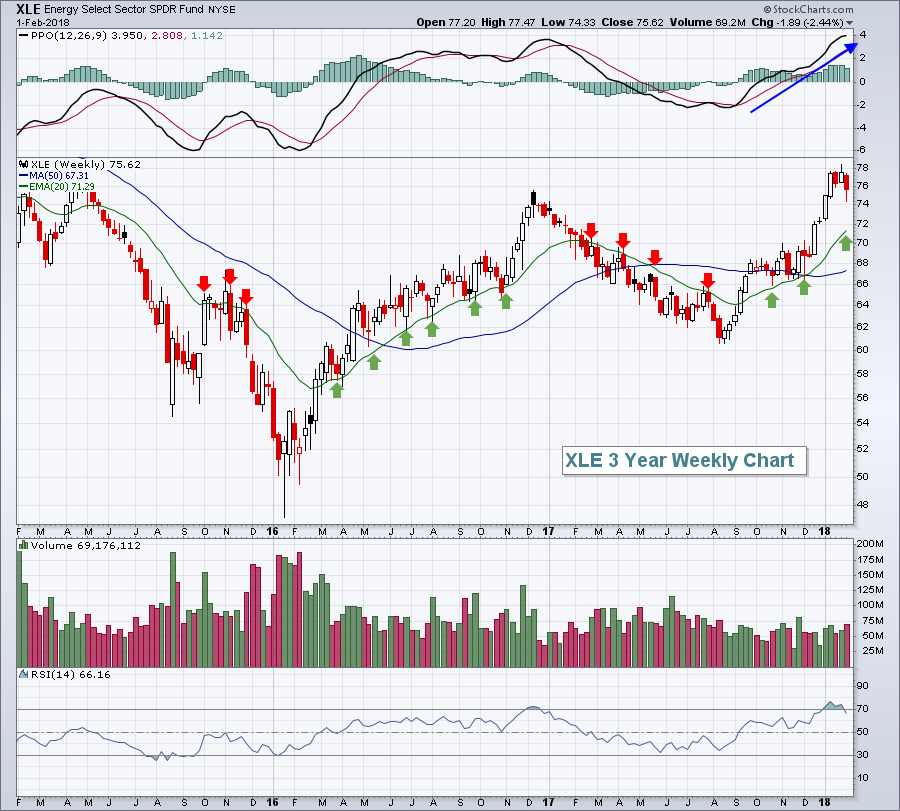 Here on the weekly chart, I'm highlighting the significance of 20 week EMA support/resistance during uptrends/downtrends. The red arrows show how the 20 week EMA provides difficult resistance during downtrends, while the green arrows show the solid support provided by the rising 20 week EMA. Currently, that rising 20 week EMA is at 71.29. Now remember that the 50 day SMA is currently at 72.25.
Therefore, if we see the XLE continue to weaken, the closer we get to that 71.29-72.25 moving average support zone, the better the reward to risk ratio into the XLE becomes. These moving averages will both be rising as well so check them often.
Historical Tendencies
The S&P 500 has historically performed well during two periods in February - the first three days of the month and then from February 11th through 15th. The rest of February tends to be a struggle. Since 1950, here are the annualized returns for the bullish and bearish periods:
Bullish (Feb 1-3 and Feb 11-15): +30.45%
Bearish (Feb 4-10 and Feb 16-29): -10.54%
Key Earnings Reports
(actual vs. estimate):
AON: 2.35 vs 2.34
AZN: 1.30 vs .45
BT: .42 vs .46
CHTR: vs .85 (haven't seen actual yet)
CVX: vs 1.27 (haven't seen actual yet)
EL: 1.52 vs 1.44
HMC: 1.11 vs .78
LYB: 2.73 vs 2.52
MRK: .98 vs .94
PSX: 1.07 vs .86
ROP: 2.70 vs 2.61
S: (.02) vs (.04)
SNE: 1.89 vs 1.15
WY: .31 vs .35
XOM: .88 vs 1.06
Key Economic Reports
January nonfarm payrolls released at 8:30am EST: 200,000 (actual) vs. 175,000 (estimate)
January private payrolls released at 8:30am EST: 196,000 (actual) vs. 172,000 (estimate)
January employment rate released at 8:30am EST: 4.1% (actual) vs. 4.1% (estimate)
January average hourly earnings released at 8:30am EST: +0.3% (actual) vs. +0.3% (estimate)
January consumer sentiment to be released at 10:00am EST: 95.0 (estimate)
December factory orders to be released at 10:00am EST: +1.5% (estimate)
Happy trading!
Tom
