Market Recap for Monday, March 26, 2018
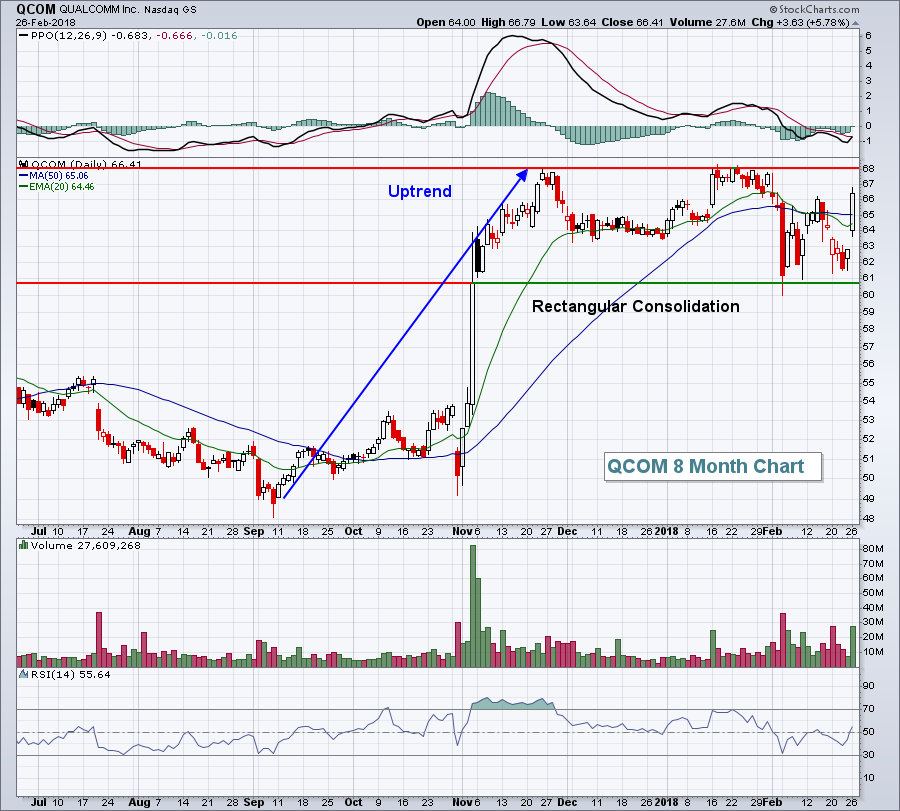
Monday was a very solid day for U.S. equities. All of our major indices roared to higher levels, led by the 400 point gain on the Dow Jones Industrial Average ($INDU). Eight of nine sectors advanced, with only the defensive utilities group (XLU, -0.30%) finishing in the red. Technology (XLK, +1.57%) led the power surge as telecom equipment ($DJUSCT) broke to a new all-time high behind strength from QUALCOMM (QCOM). QCOM's 5.78% rise put it within reach of a key breakout:
 Semiconductors ($DJUSSC) and computer hardware ($DJUSCR) were also very strong on Monday and they've both completed what could be bullish cups off of the panicked lows of early February:
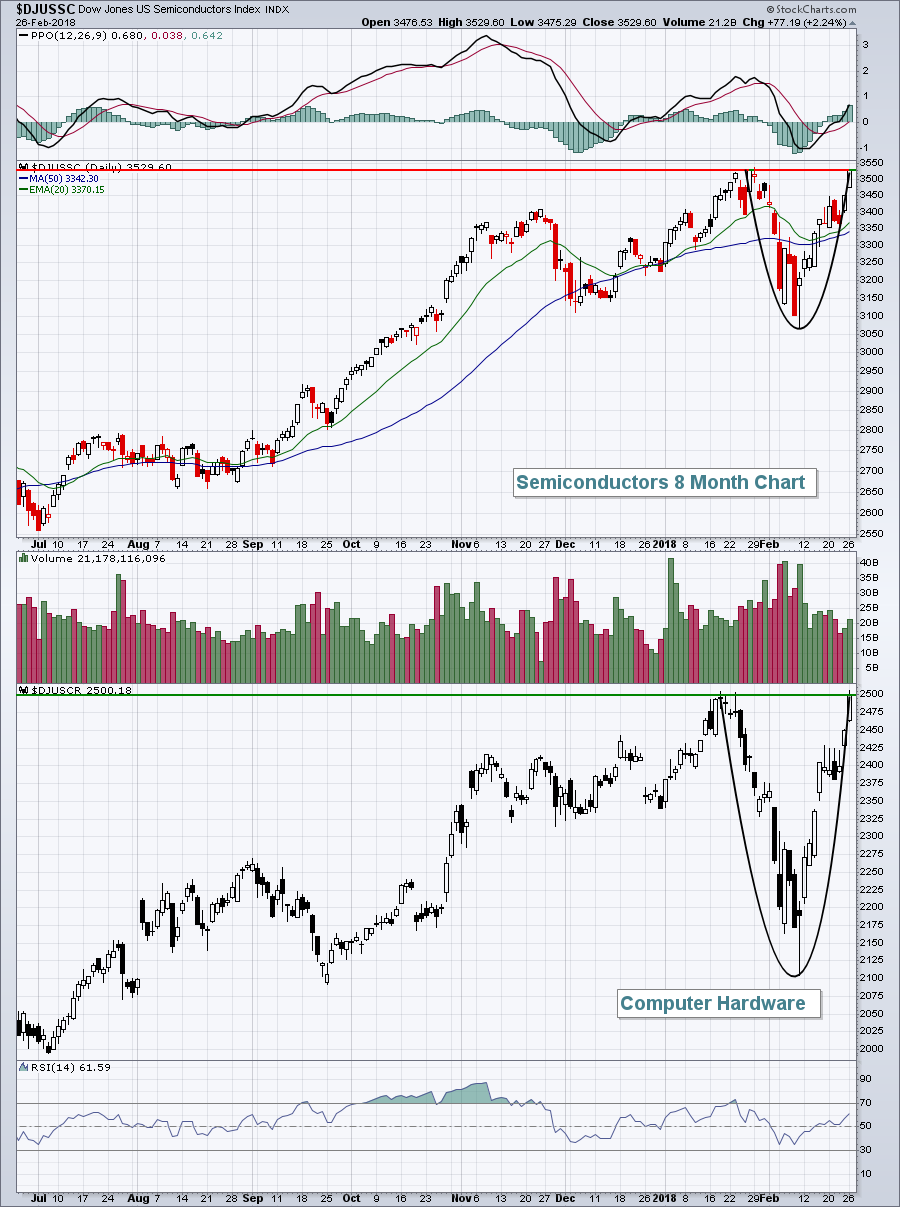 They're not exactly rounded cups, but the technical meaning of these patterns is essentially the same as a cup. A trip back to test their rising 20 day EMA's would be bullish entry points with solid reward to risk potential.
Financials (XLF, +1.51%) and industrials (XLI, +1.38%) were very strong on Monday as well as money poured into riskier assets - a continuing bullish development.
Pre-Market Action
Shares in Asia paused overnight, although the Tokyo Nikkei ($NIKK) managed to gain another 236 points. There's mostly weakness in Europe this morning and futures here in the U.S. are down slightly. Dow Jones futures are lower by 33 points with 45 minutes left to the opening bell.
Toll Brothers (TOL) beat earnings expectations and we have a couple economic reports in the housing area at 9am EST. The Dow Jones U.S. Home Construction Index ($DJUSHB) has been an awful relative performer in 2018 so it'll be interesting to see if today's events help to spur a rally in the group.
Current Outlook
We've recovered significantly off of the recent bottom and history is almost always the best teacher in the stock market. On February 7th, I went out on a limb and called a market bottom based on the massive surge in the VIX and what appeared to be a capitulatory selloff and reversal on very heavy volume. While the market did move lower one more time, eclipsing that prior low by another 2% or so, that selling episode did mark a very significant bottom. If nothing else, let's try to learn from these events. Yes, violent selling is scary, but we need to avoid the media's attempt to scare the you know what out of us and instead concentrate on what the "below the surface signals" are telling us. There is no history that I'm aware of that suggests we go from bull market to bear market in a few trading days, yet that's exactly what media outlets were trying to sell us. Fear sells, it's as simple as that. Fear generates ratings and ratings increase ad dollars. There's nothing wrong - as a short-term trader - to become more defensive during bouts of craziness and perhaps even move entirely to cash. But your mindset should be to use such selling to your advantage to move into positions during overdone selloffs.
Go back to my February 7th article and read through the Market Recap and Current Outlook sections. It's not easy to remain calm and make rational decisions when the VIX hits 30, 40 or 50, but we do need to realize that it's these extreme VIX readings that have historically marked very significant bottoms. In bear markets, these extreme readings tend to mark temporary bottoms, while in bull markets they tend to mark major bottoms. I'm of the opinion that we just marked a major bottom in a bull market. Until history proves me wrong, I'll trade on that premise.
Sector/Industry Watch
The Dow Jones U.S. Software Index ($DJUSSW) didn't wait for the major indices. It broke out to all-time highs yesterday as many individual software stocks did the same. Check out the chart:
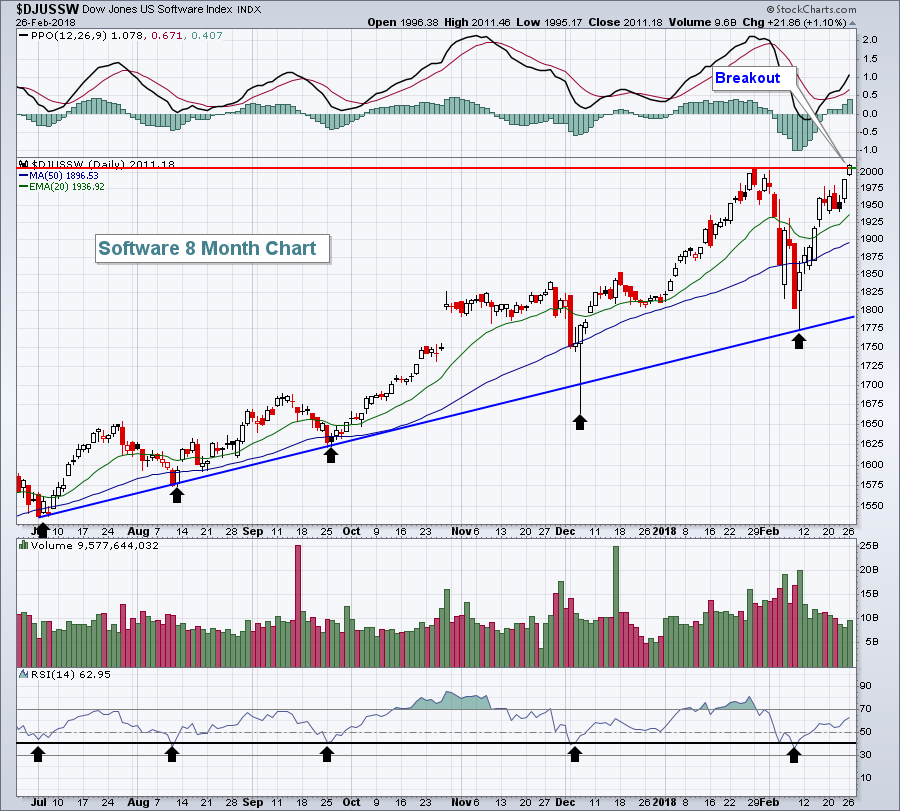 Those black arrows are very telling. During uptrends, RSI 40 readings typically provide excellent support. Price and trendline support are obviously much better indications to watch for support, but if you study history, you'll find that many uptrends see excellent support when the RSI dips below 50, especially when it reaches the 40 level.
Historical Tendencies
The last few trading days of calendar months tend to be very bullish. February, however, is a bit of an anomaly. Since 1950 on the S&P 500, here are the annualized returns for the following calendar days:
February 25: +7.06%
February 26: +16.59%
February 27: -38.41%
February 28: -7.33%
February 29: -15.19% - GOOD NEWS: There is no February 29th this year! :-)
Key Earnings Reports
(actual vs. estimate):
AMT: 1.59 vs 1.68
AZO: 4.23 vs 8.81
BMO: vs 1.66 (awaiting results)
BNS: 1.45 vs 1.31
FMS: .69 vs .61
SRE: 1.54 vs 1.40
(reports after close, estimate provided):
EC: .30
EOG: .52
ESRX: 2.09
FMX: 1.08
PCLN: 14.12
SQ: .07
WDAY: .21
Key Economic Reports
January durable goods released at 8:30am EST: -3.7% (actual) vs -2.0% (estimate)
January durable goods ex-transports released at 8:30am EST: -0.3% (actual) vs +0.3% (estimate)
December S&P Case Shiller Index to be released at 9:00am EST: +0.6% (estimate)
December FHFA house price index to be released at 9:00am EST: +0.5% (estimate)
February consumer confidence to be released at 10:00am EST: 126.4 (estimate)
Happy trading!
Tom
