Market Recap for Wednesday, January 31, 2018
Following the heavy selling on Tuesday, the bulls were just hoping to stop the bleeding. I'd say they had some success as the Dow Jones, S&P 500 and NASDAQ all finished in positive territory. Overall action was bifurcated, however, as small caps ended the session in negative territory. In pre-market action, the latest ADP employment report showed that strength in jobs continues. In January, the ADP report came in at 234,000 jobs, easily outpacing the 195,000 consensus estimate. That generally bodes well for the Friday nonfarm payrolls report, but not always. At 2pm on Tuesday, the FOMC delivered its latest policy statement, leaving interest rates unchanged, but now expecting a rise in inflation later this year. That development triggered a very quick bond market selloff, but things settled down rather quickly after that:
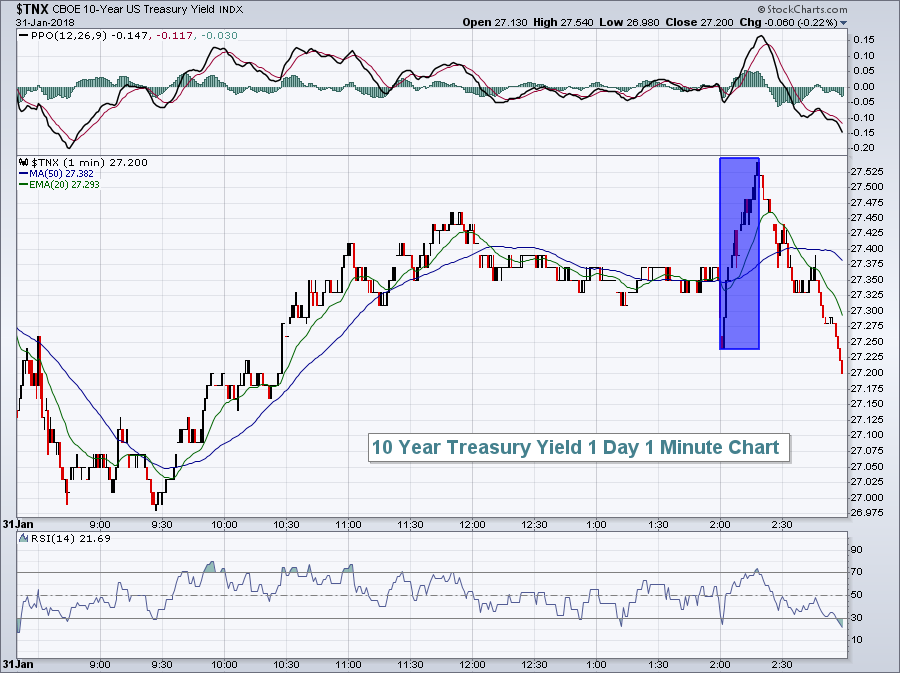 The blue highlighted area shows the TNX soaring just after the announcement that we should expect a pick up in inflation. The bond market did settle down after that as yields fell back below the TNX level at the time of the announcement. Still, treasury yields do remain in an uptrend and the close at 2.72% represents a 32 basis point jump during the month of January. The bond market sees higher rates ahead. Don't be surprised if we get another 2-3 rate hikes during 2018. In my opinion, that's what the Fed was hinting at during its announcement yesterday.
Our major indices have all seen their daily RSIs fall back below 70, a positive development as this current bull market could certainly use a rest. We could see additional selling or sideways consolidation to accomplish this. Further buying and price acceleration would simply make our next bout of selling much more emotional and difficult.
While we did see a rebound in many areas on Wednesday, do not include small caps ($RUT, -0.49%) and healthcare (XLV, -1.42%) among those areas. Pharmas ($DJUSPR) and biotechs ($DJUSBT) both fell more than 2% yesterday after very strong action throughout much of January. I still like both of these groups and believe short-term selling will lead to solid reward to risk trading opportunities. Pfizer (PFE, -2.01%), Amgen (AMGN, -2.73%, reports earnings after the close today) and Illumina (ILMN, -3.54%) are among a few of the names worth considering.
Pre-Market Action
Today is a big earnings day. After the bell today, we'll get the latest earnings from Apple, Inc. (AAPL), Amazon.com (AMZN), Alphabet (GOOGL) and Amgen (AMGN).
Dow Jones futures are down 129 points with close to 45 minutes left to the opening bell. Overnight in Asia, the Tokyo Nikkei ($NIKK) rallied nearly 400 points to end its six session losing streak. European stocks are lower this morning with the German DAX ($DAX) down more than 1% as it approaches the 13,000 level again.
Oil prices ($WTIC) are up 1% this morning after successfully testing its rising 20 day EMA on Wednesday. Crude oil is looking for its first close above $67 per barrel since late-2014.
Current Outlook
The Russell 2000 continues to lag its larger cap index counterparts and, after closing beneath its rising 20 day EMA on Wednesday, now faces more serious price and trendline support levels:
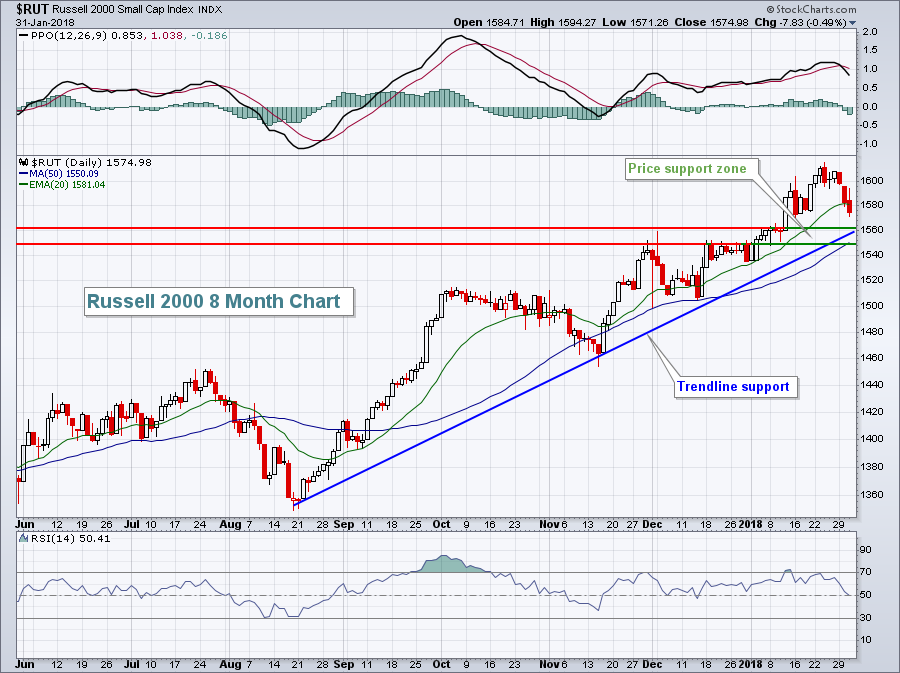 I'd look for a reversal somewhere in the 1550-1560 area. Note that the 50 day SMA also resides at the 1550 level. Finally, the daily RSI is now at 50. RSI 40-50 typically provides excellent support during an uptrend so the move down to 50 provides yet one more technical indication that we could be approaching a significant short-term bottom in the RUT.
Sector/Industry Watch
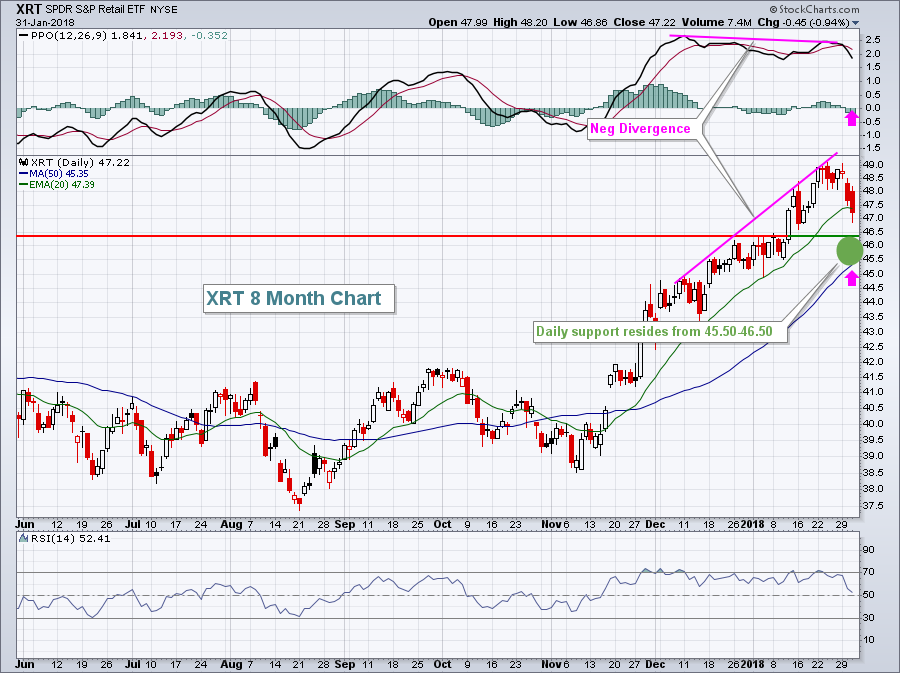
Well, it's February and this time of year belongs to the retail industry (XRT). I've talked countless times about the seasonal strength of retail from February through April, so it's probably a good time to check in on the group. First, from a daily chart perspective:
 And now from a weekly perspective:
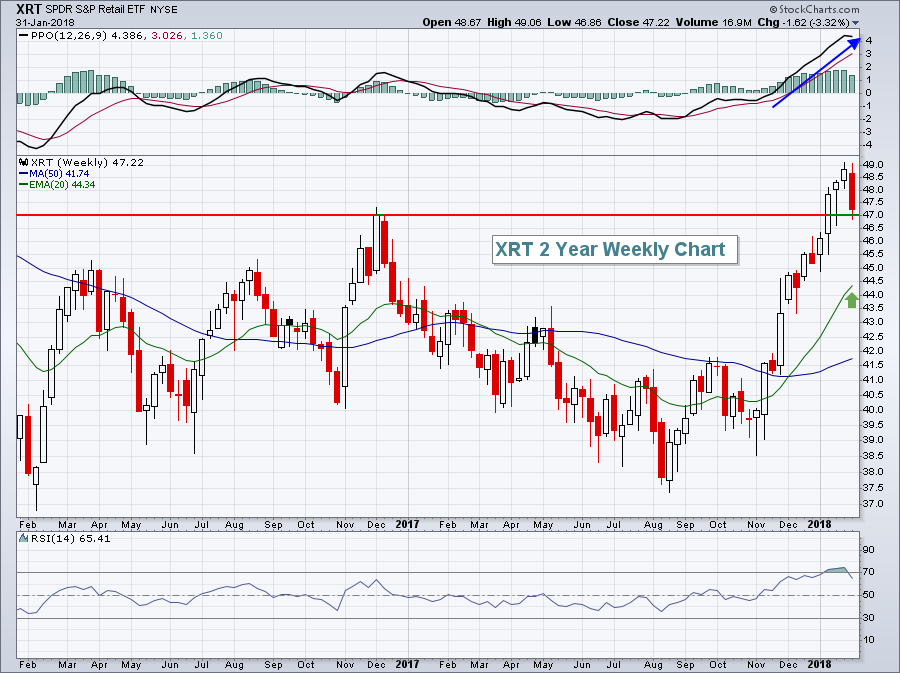 Despite the 3.32% drop this week, the XRT remains very strong technically on a weekly basis. It just tested price support near 47 and has held thus far. The biggest support in my view, however, is the rising 20 week EMA because of the strength in the PPO. That 20 week EMA is at 44.34 currently and rising rapidly.
The daily chart actually shows a negative divergence, a signal of slowing price momentum. In these situations, it's not uncommon to see a PPO centerline test and 50 day SMA test (pink arrows). This would suggest a possible move lower to 45.35 (50 day SMA currently). Price support is closer to 46.50 on the daily chart.
All of this analysis on these two different timeframes tells me that retail is definitely an area to consider for investment over the next 2-3 months. However, the closer that price drops to 44.50-45.50, the better the reward to risk gets.
Historical Tendencies
Gap, Inc. (GPS) is an apparel retailer that tends to perform exceptionally well during February and March, with average monthly returns of +3.5% and +4.0%, respectively, over the past two decades. After a negative divergence printed in December, GPS tested its 50 day SMA yesterday for the first time since it saw this sign of slowing price momentum:
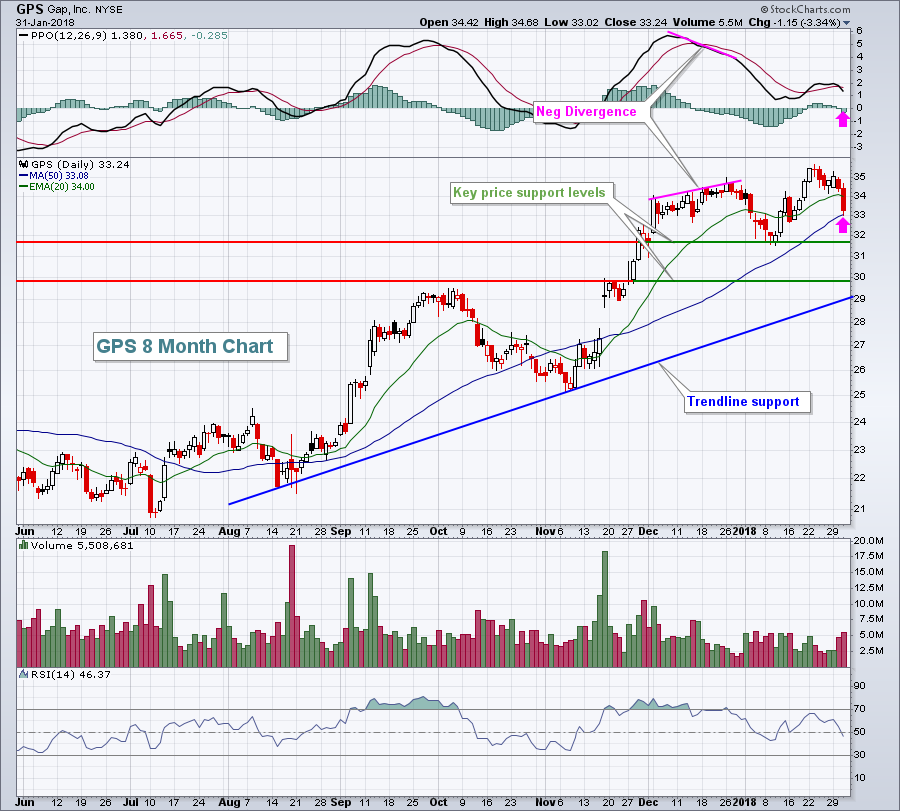 It's always difficult to pick which support will be the strongest and when the stock will turn higher, but I'd look for a reversing candle at one of the levels provided above and any move below 32.00 would begin to catch my attention.
Key Earnings Reports
(actual vs. estimate):
APTV: 1.28 vs 1.33
BABA: 1.63 vs 1.65
BAX: .64 vs .59
BSX: .34 vs .34
BX: .71 vs .70
CI: 1.94 vs 1.87
CME: 1.12 vs 1.10
COP: .45 vs .42
DWDP: .83 vs .67
ETN: 1.29 vs 1.25
HSY: 1.03 vs 1.06
IP: 1.27 vs 1.19
MA: 1.14 vs 1.12
MCK: 3.41 vs 2.92
MMC: 1.05 vs .95
MO: .91 vs .80
MPC: 1.05 vs .96
NOK: .15 vs .11
PH: 2.15 vs 2.06
RACE: .71 vs .71
RDS.A: 1.04 vs 1.02
TWX: 1.60 vs 1.44
UPS: 1.67 vs 1.65
VLO: 1.16 vs 1.06
(reports after close, estimate provided):
AAPL: 3.82
AMGN: 3.04
AMZN: 1.85
GOOGL: 10.12
EW: .90
Key Economic Reports
Initial jobless claims released at 8:30am EST: 230,000 (actual) vs. 235,000 (estimate)
Q4 productivity released at 8:30am EST: -0.1% (actual) vs. +1.1% (estimate)
January PMI manufacturing index to be released at 9:45am EST: 55.5 (estimate)
January ISM manufacturing index to be released at 10:00am EST: 58.6 (estimate)
December construction spending to be released at 10:00am EST: +0.5% (estimate)
Happy trading!
Tom
