Market Recap for Wednesday, March 21, 2018
It was a volatile session on Wednesday, particularly after 2pm EST when the FOMC policy statement was released. In Fed Chairman Jerome Powell's first meeting as Fed Chief, the Fed raised the benchmark funds rate a quarter point from 1.50% to 1.75%. It was the sixth time rates have been raised since December 2015. The funds rate is very closely tied to consumer interest rates. The Fed also raised its economic forecast, saying that "the economic outlook has strengthened in recent months", new language from previous policy statements.
While no major price support or resistance levels were cleared at Wednesday's close, the intraday volatility surged soon after the 2pm announcement:
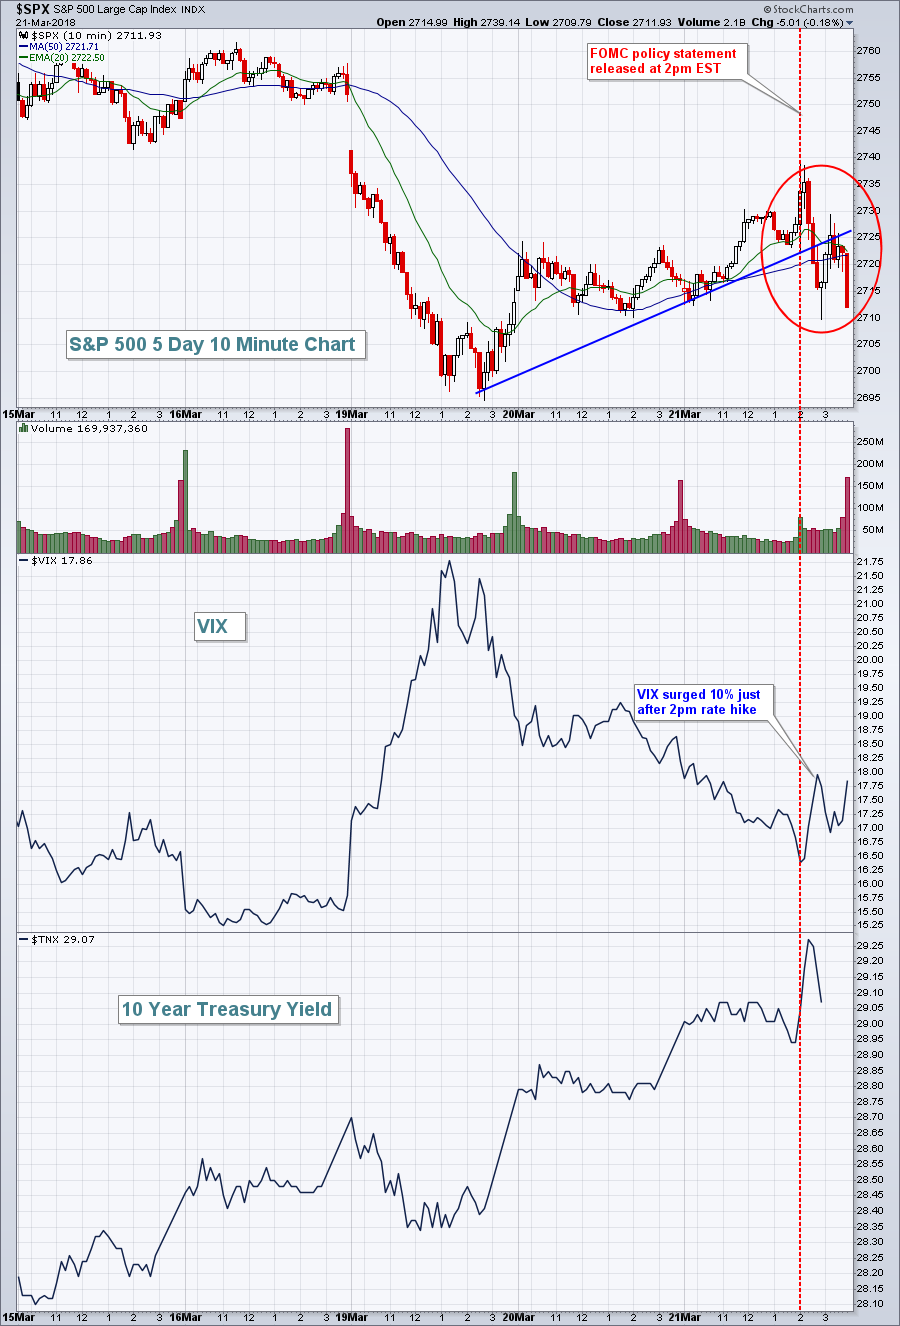 The red circle above highlights some fairly wide swings in the S&P 500 in the final two hours of trading yesterday. By day's end, the S&P 500's two day uptrend had ended and we closed near our lows of the day, setting up more short-term price weakness.
Energy (XLE, +2.62%), though it finished off its highest levels of the session, did manage to touch 69.00 and test the late-February high, before retreating just beneath it. Still, energy was clearly Wednesday's big winner. Materials (XLB, +1.13%) also had a nice day as the U.S. Dollar Index ($USD) fell 0.65%. The USD continues to fluctuate in a very meaningful range between 88 and 91. 88 represents a long-term uptrend line dating back to the 2011 low and also coincides with the 2009/2010 double top breakout that occurred in late-2014. Broken price resistance becomes price support. So there's much at stake at that 88 level for the USD.
Among industry groups, home construction ($DJUSHB, +1.93%) led on a relative basis, which hasn't happened much since this group topped in the latter half of January. Existing home sales came in above expectations and that seemed to resuscitate the industry - at least temporarily. Computer hardware ($DJUSCR, -1.92%) was one of the weakest industries as Apple, Inc. (AAPL) failed to hold onto recent price support and its 50 day SMA, setting up the likelihood of additional short-term weakness:
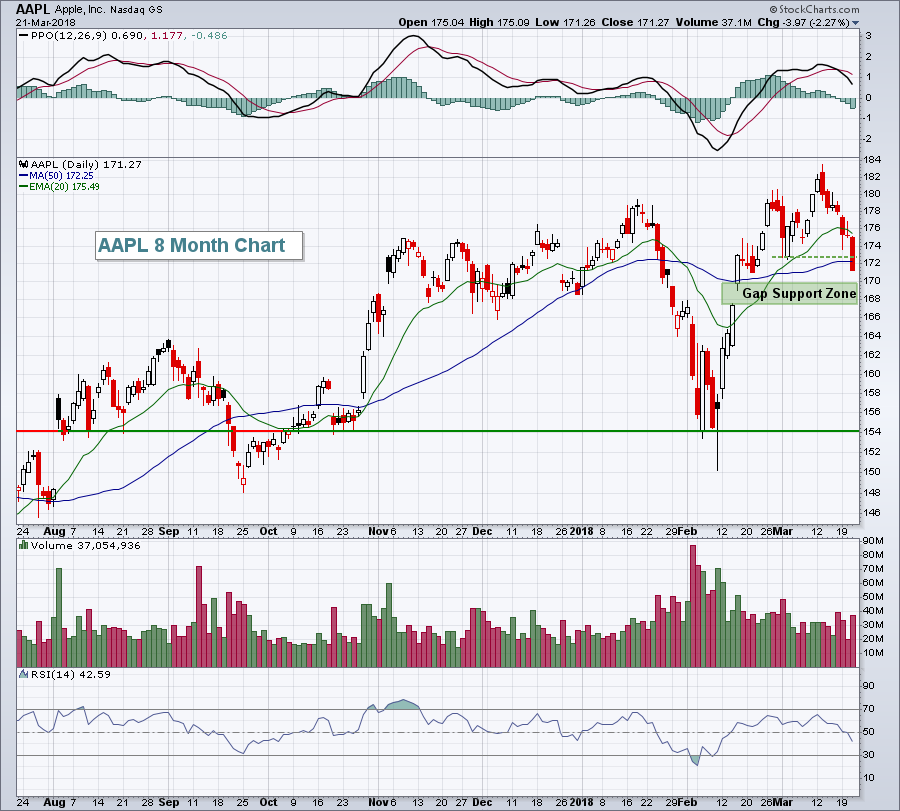 AAPL is widely recognized as the technology leader and strength in technology recently propelled the NASDAQ to record all-time closing highs. Obviously, failure to hold onto short-term price support (horizontal green-dotted line) is a negative for the market. It becomes a bigger issue if gap support doesn't hold because I don't see much support between gap support and that February support line near 154.
Pre-Market Action
The 10 year treasury yield ($TNX) is down 7 basis points, the morning after the Fed indicated there'll be more rate hikes down the road. Interesting. Gold ($GOLD), meanwhile, is on the rise, gaining more than $10 this morning to $1332. Crude oil ($WTIC) is down fractionally this morning, after topping $65 per barrel on Wednesday.
Overnight, the Hang Seng Index ($HSI) rose more than 1% while the Nikkei ($NIKK) fell nearly 1%. The selling in Europe this morning is fairly intense with the German DAX ($DAX) down 162 points (-1.32%) at last check.
Dow Jones futures are extremely weak, down 272 points as we approach the opening bell.
Current Outlook
Volatility ($VIX) has picked up again over the past couple weeks - not great news for the bulls. However, each spike in the VIX has been topping at lower levels, indicative of dissipating fear - and that is very good news for the bulls. But consolidation is a process and it's difficult to measure how long it will last. The fact that the NASDAQ was able to break to new record highs recently does provide give me hope that the consolidation will be rather short-term in nature. As baseball great Yogi Berra would say, however, "it ain't over til it's over". Price action will confirm when it's over. The following chart does show that market fear seems to be leveling off:
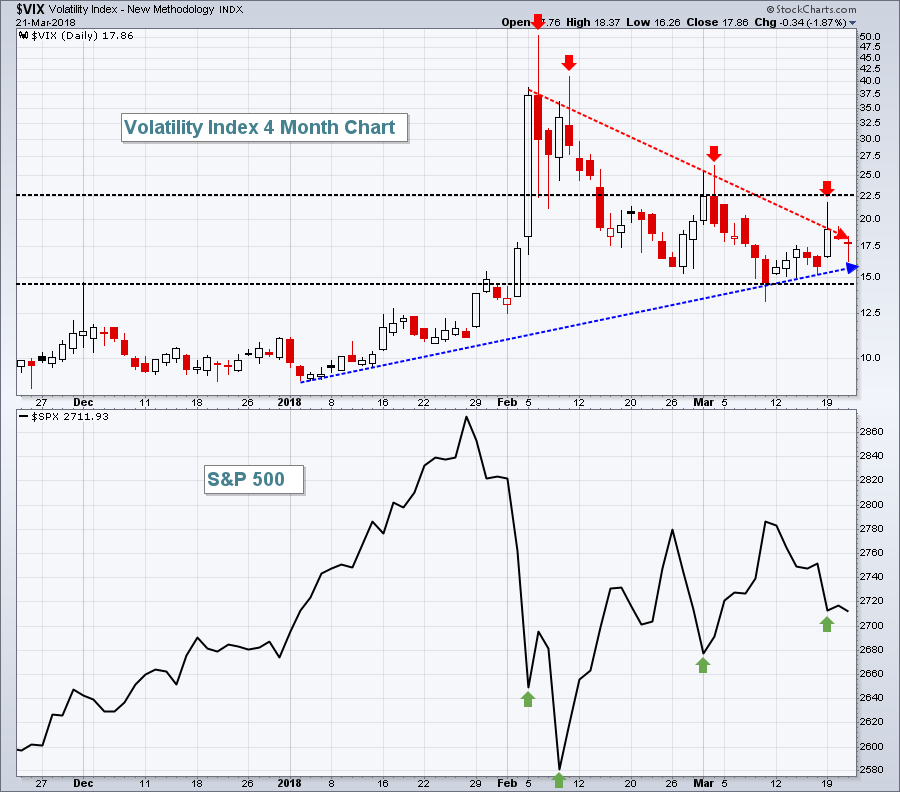 The rising lows on the VIX date back to the beginning of 2018, while the declining VIX highs date back to the early February panicked selloff. The horizontal black-dotted lines highlight two key absolute levels to watch on the VIX. A break above 22.50 would likely result in bears becoming much more aggressive and drops accelerating to the downside. Should the VIX push back below 14.50, however, I'd expect to see the big intraday swings subside and for the nine year bull market to resume in full force.
Sector/Industry Watch
The Dow Jones U.S. Tobacco Index ($DJUSTB) broke down horribly on Wednesday as you can see below:
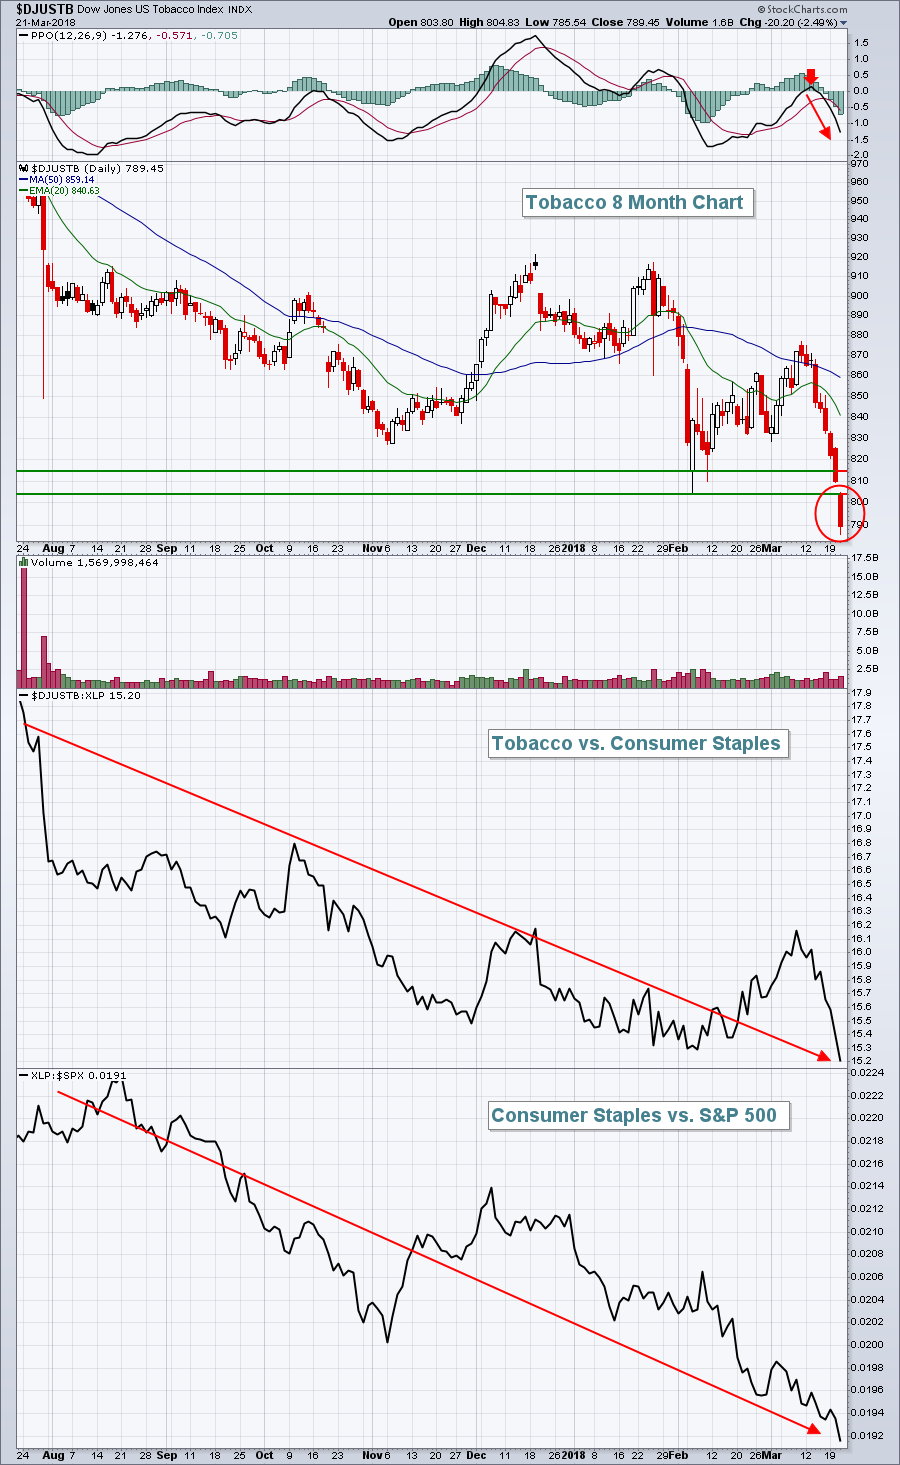 In my view, this is the poster child of an industry group that I want no part of. Not only do we see a technical breakdown in the DJUSTB, clearing recent price lows, but we also see that the DJUSTB is underperforming its peers in consumer staples (XLP) on a relative basis. Furthermore, the XLP is wildly underperforming the benchmark S&P 500. Trying to outperform the benchmark index with stocks in a space like this is nearly impossible. Could we see a short-term oversold bounce? Of course. But when will it occur? As you can see from the PPO, bearish price momentum is accelerating.
I'll take a pass.
Historical Tendencies
I suggested that tobacco stocks should be avoided based on the technical indications reflected above. For those interested in jumping into the beaten-down group, history is on your side. The DJUSTB has averaged gaining 2.4% and 3.9% in April and May, respectively, over the past two decades. Seasonally, these are the two best consecutive months to trade tobacco stocks on the long side. Personally, I always side with technical indications, but I wanted to give the other side of the story.
Key Earnings Reports
(actual vs. estimate):
ACN: 1.58 vs 1.50
CAG: .61 vs .55
CCL: .43 (estimate - still awaiting results)
DRI: 1.71 vs 1.64
(reports after close, estimate provided):
CTAS: 1.24
MU: 2.76
NKE: .52
Key Economic Reports
Initial jobless claims released at 8:30am EST: 229,000 (actual) vs. 225,000 (estimate)
January FHFA house price index to be released at 9:00am EST: +0.3% (estimate)
March PMI composite flash to be released at 9:45am EST: 55.2 (estimate)
February leading indicators to be released at 10:00am EST: +0.3% (estimate)
Happy trading!
Tom
