Market Recap for Friday, March 9, 2018
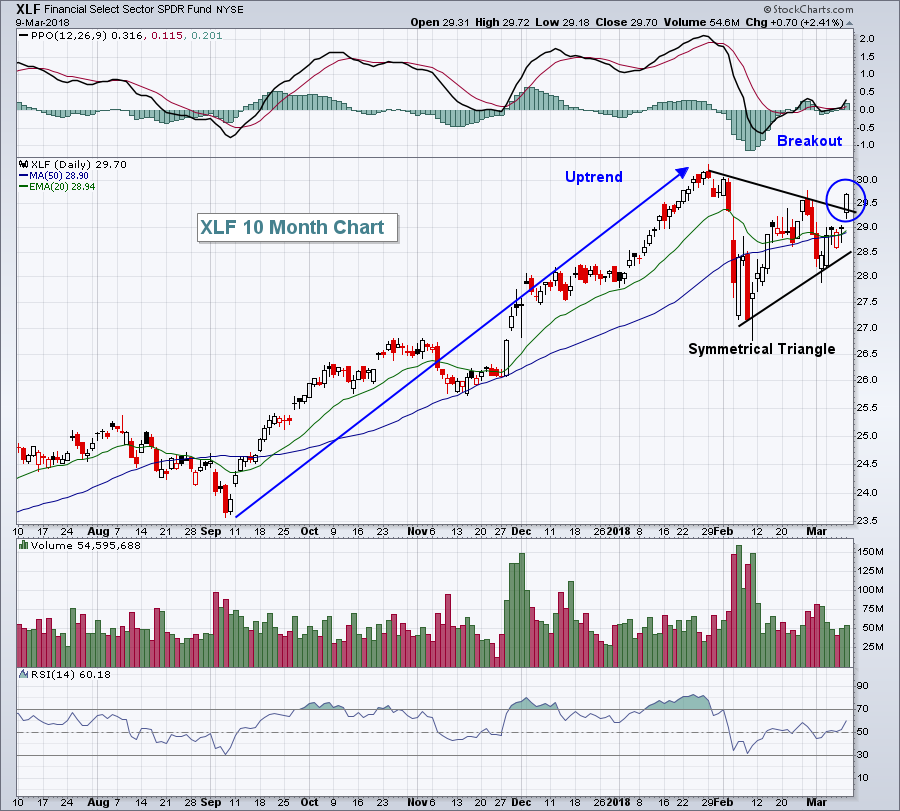
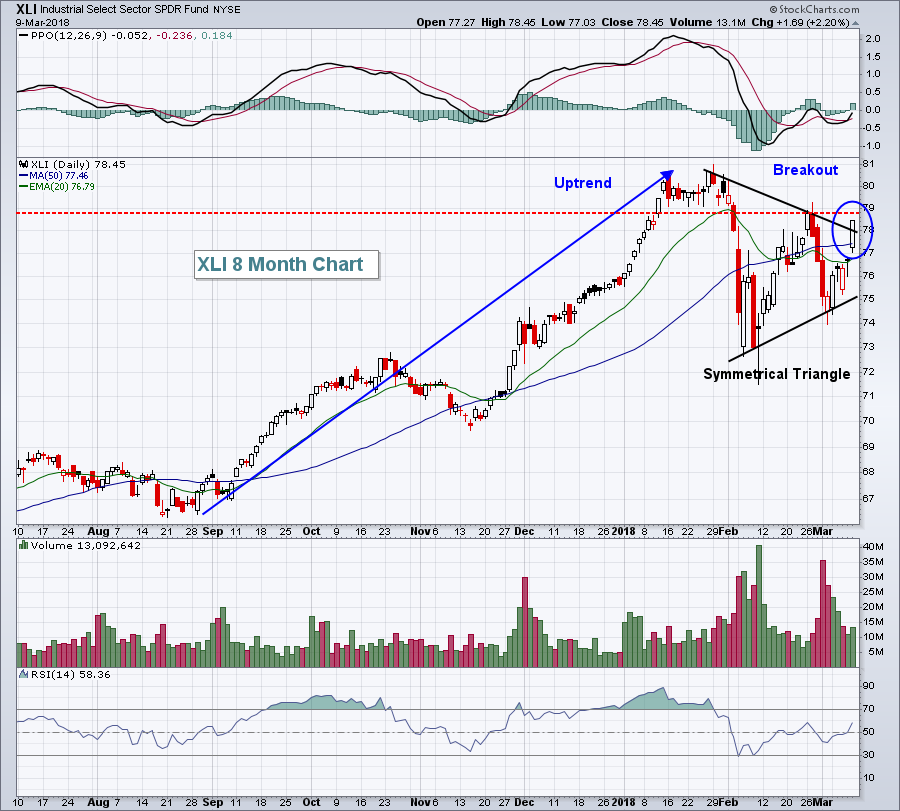
The U.S. stock market was back to its old bull market tricks on Friday as the NASDAQ powered 133 points higher (+1.79%) to close at 7560.81 - its highest ever - and end its correction that began with the high volatility selloff in late-January and early-February. For those in the bear market camp, let me just say they don't start with all-time high closes on the aggressive NASDAQ Composite. The strength and bullishness didn't end with the NASDAQ. Money rotated to aggressive sectors as well. Financials (XLF, +2.41%) and industrials (XLI, +2.20%) once again led the action, similar to what we saw in November 2016 when this latest bull market rage started. The XLF broke out of a bullish symmetrical triangle pattern:
 The XLI broke out of a similar pattern, although unlike the XLF, the XLI didn't clear the late-February reaction high yet:
 The February nonfarm payrolls report was the catalyst for Friday's rally as jobs totaled 313,000, soaring past the 205,000 consensus estimate. Not only did we see that huge February spike, but January's numbers were revised considerably higher, from 200,000 to 239,000. Finally, all of this occurred with the average hourly earnings rising just 0.1%, below the anticipated 0.2% level. So we received a big jobs report while wage inflation was stymied - a powerful combo, especially given the recent inflationary worries.
Pre-Market Action
Asian markets were very solid overnight with the Tokyo Nikkei ($NIKK) and Hong Kong Hang Seng Index ($HSI) up 1.65% and 1.93%, respectively. That's carried over to nice strength in Europe. In particular, the German DAX ($DAX) is climbing back above its 20 day EMA with a positive divergence in play. I'm looking for more strength ahead for Germany this week.
In the U.S., the bond market is flat, while gold ($GOLD) and crude oil ($WTIC) are down 0.54% and 0.85%, respectively. Dow Jones futures look to open up higher, currently up 46 points with 30 minutes left to the opening bell. NASDAQ futures are suggesting further outperformance by this tech-laden index after finishing at an all-time high on Friday.
Current Outlook
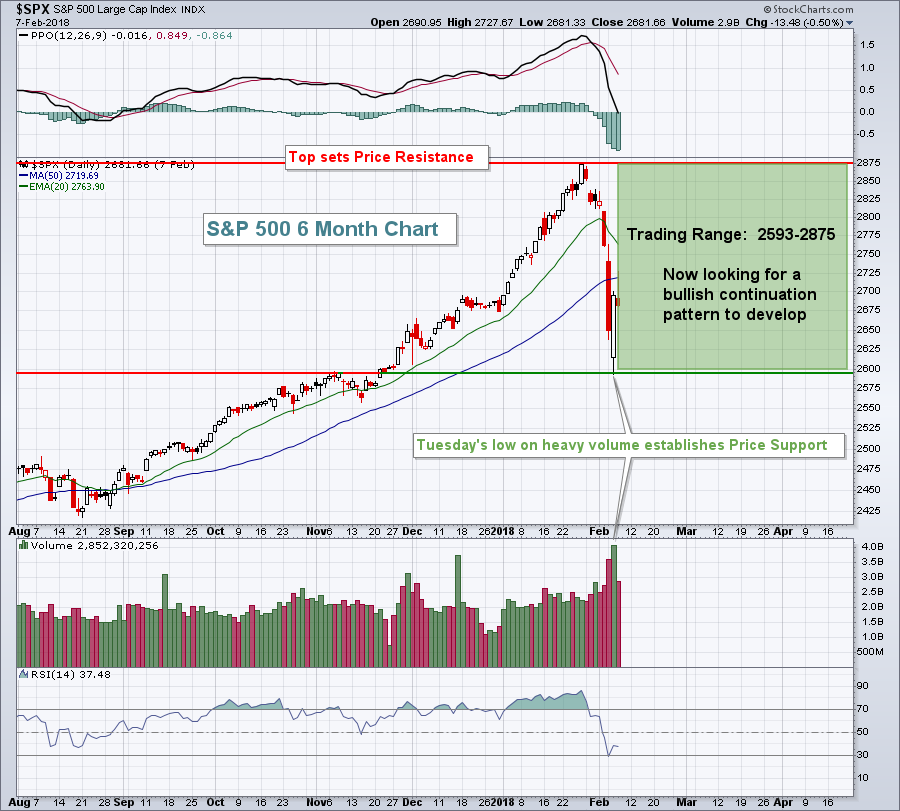
A little over one month ago, I posted a chart of the S&P 500, anticipating a potential continuation pattern. Here was the chart:
 The S&P 500 did make one more move down very quickly, but since has consolidated in what appears to be a bullish symmetrical triangle continuation pattern:
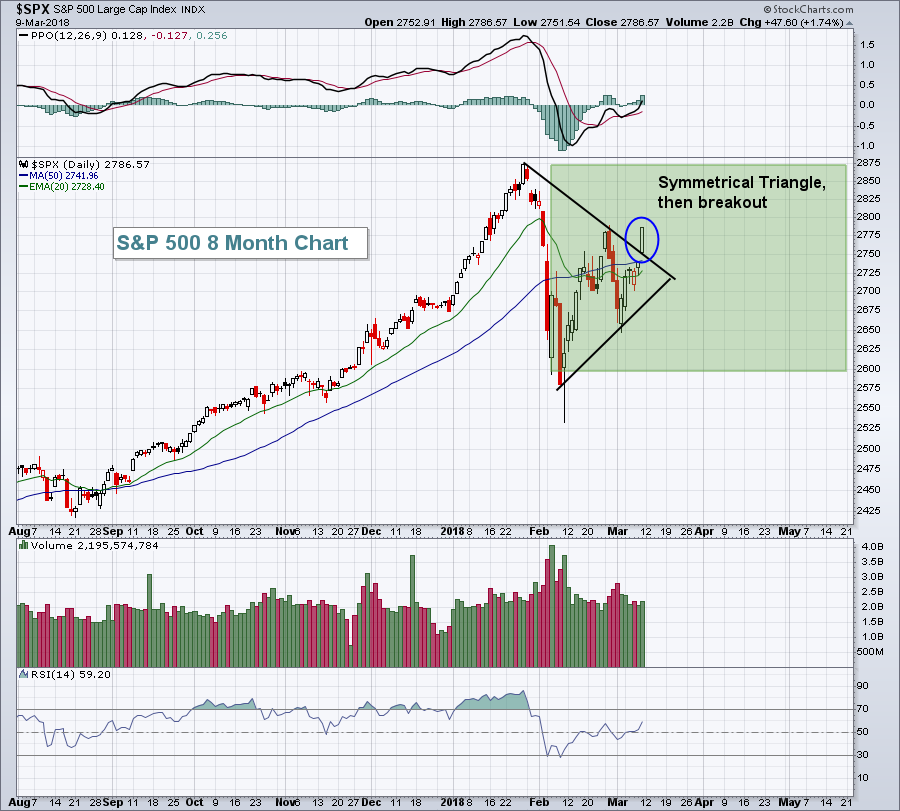 Friday's breakout is very bullish, although it's entirely possible that a new short-term high prints (prior to clearing the late-January high) and further consolidation occurs. The primary reason why I don't believe that will occur is that we've seen leadership from aggressive areas with a major breakout in the NASDAQ to all-time highs. That's a very bullish confirming sign that the current bull market is advancing into its next phase - another run higher.
Sector/Industry Watch
Keep an eye on home construction ($DJUSHB). Yes it's been a major laggard in 2018 thus far. But it was a major outperformer in 2017 and it's entitled to a period of underperformance. It could be in the process of establishing a significant bottom based on the positive divergence that's formed:
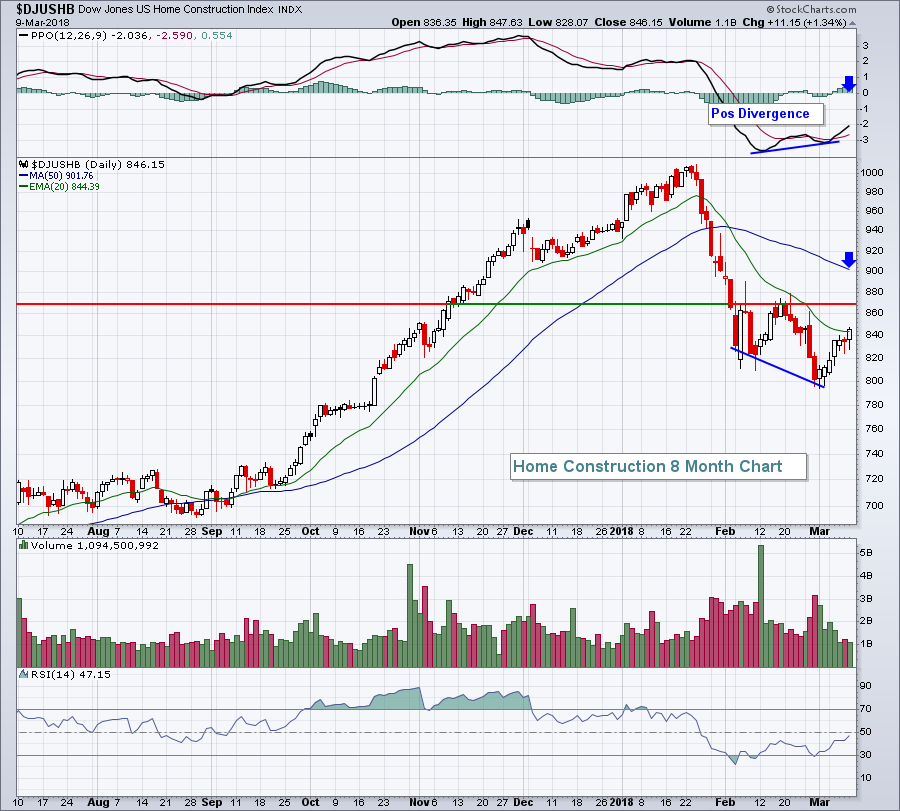 The close above the 20 day EMA with a positive divergence in play is a bullish development for home construction. I would not be at all surprised to see relative strength emerge as the DJUSHB makes a run at its 50 day SMA and a PPO centerline test (blue arrows). Given that we're in a bull market, I apply bull market rules. That suggests that this bottom in the DJUSHB could be a major bottom. I know it's a bit risky, but considering the ITB (ETF that tracks the DJUSHB) or your favorite individual home construction stock might not be a bad idea right now.
Monday Setups
I'm going to stick with home construction for my Monday setup. I believe last week's strength in the group is quite sustainable so here's my pick for this week:
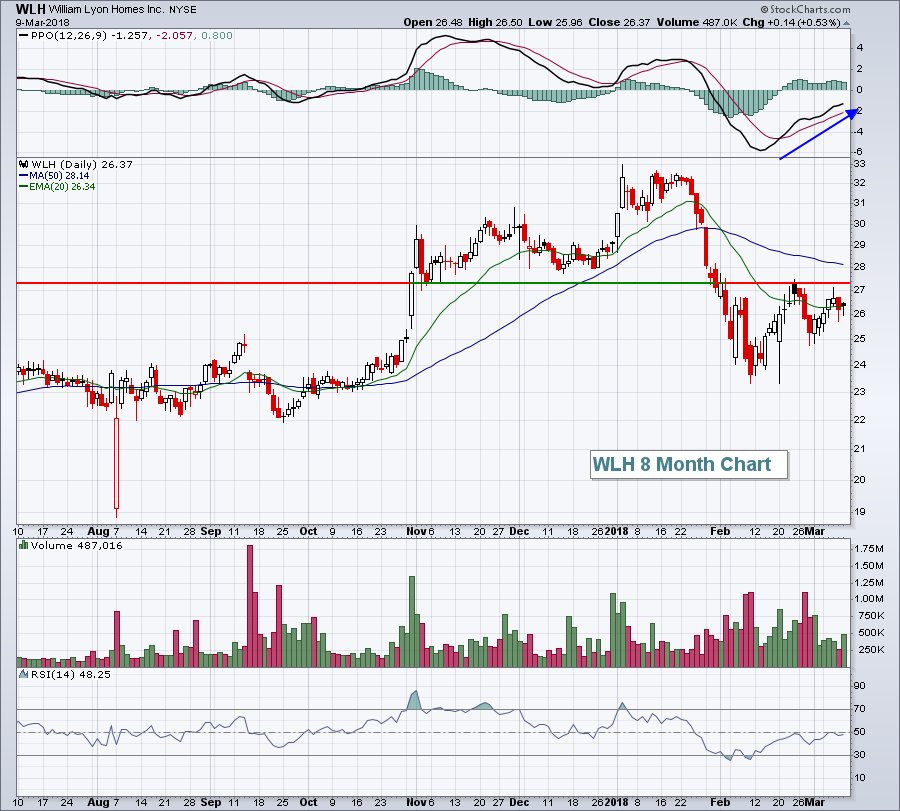 We are seeing significant improvement in the PPO and WLH tried to hold above its 20 day EMA most of last week. In my opinion, that's a good sign. I look for home construction and WLH to have a solid week ahead.
I will be adding additional trade setups later this morning. You can check out this week's and all of my recent trade setups HERE.
Historical Tendencies
We've now entered a bullish historical period within calendar months. The most bullish period is from the 26th through the 6th as the stock market anticipates, then sees, money pouring into equities from market makers, portfolio managers, 401(k) plans, pension plans, hedge funds, etc. The next best period of the month is from the 11th through the 18th as the mid-month money flow sequel arrives. Here are the annualized returns on the NASDAQ (since 1971) for each of the calendar days in this period:
11th: +21.48%
12th: +14.74%
13th: +26.12%
14th: +8.89%
15th: -1.46%
16th: +40.12%
17th: +6.68%
18th: +23.23%
This represents the 11th through 18th in ALL CALENDAR MONTHS. In March, the bullish period extends from March 10th through 18th where the NASDAQ has produced annualized returns of +26.88% since 1971.
Key Earnings Reports
None
Key Economic Reports
None
Happy trading!
Tom
