Market Recap for Wednesday, February 28, 2018
Outside of the final two hours on Wednesday, it was a fairly boring day. We gapped higher at the open, sold off to fill the gap, and then moved back into positive territory.....until the final two hours. Selling returned in a big way and volume increased as traders decided to book profits from the latest advance and watch from the sidelines. On the S&P 500, which fell over 30 points, or 1.11%, on the session, the key upcoming support level is in the 2690-2700 area, as identified in the chart highlighted in the Current Outlook section below.
Consumer discretionary stocks (XLY, -0.45%) held up very well on a relative basis, thanks in large part to a blowout earnings report by Booking Holdings (BKNG - formerly priceline.com, or PCLN). All nine sectors finished lower, led by another very poor showing by energy (XLE, -2.30%). The XLE is resting at a critical support level:
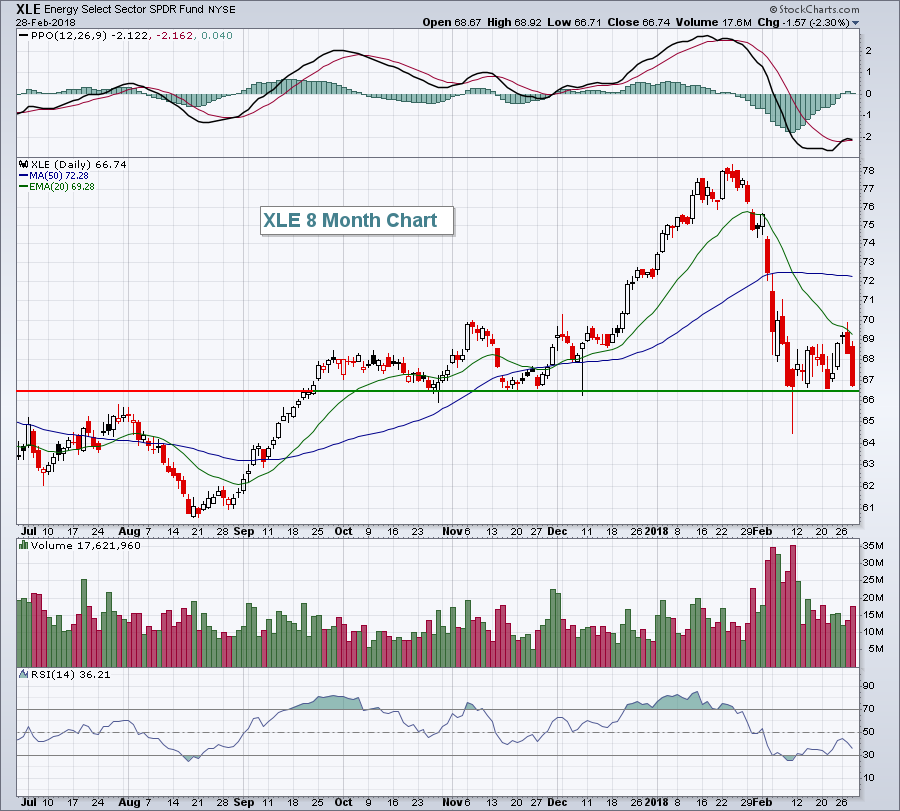 A move much below 66 would be very damaging technically, especially if the breakdown occurs on heavy volume. Be very careful here as energy has been a serious laggard the past several weeks.
Pre-Market Action
The 10 year treasury yield ($TNX) has dipped back below 2.85% this morning as its latest trend higher comes under further short-term pressure. This dip could help the more defensive utilities (XLU) and REITs ($DJR) as money could rotate somewhat away from aggressive areas of the market. Financials, in particular the banks ($DJUSBK) could certainly feel some profit taking pain if the TNX continues its short-term decline.
Markets are mixed world-wide and Dow Jones futures have rallied off earlier lows this morning. Currently, Dow futures are down just 7 points with less than 30 minutes to the opening bell.
Current Outlook
The newest downtrend is established and here's the latest look at it on the S&P 500:
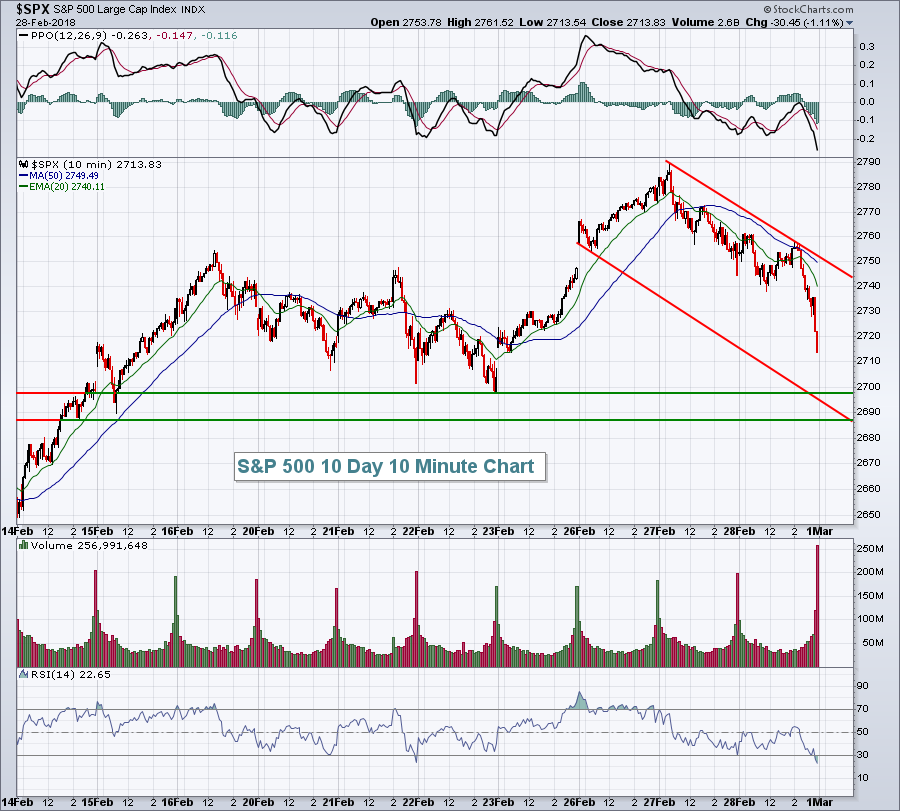 This is a very short-term chart, but the 2690-2700 support level is a solid level to watch the balance of this week. If it fails to hold, I'd expect to see the Volatility Index ($VIX) shoot higher once again and panicked selling resume. That would bring the early February lows back into play. Therefore, I'd look for the bulls to put up a fight just beneath 2700, should we get there.
Sector/Industry Watch
The Dow Jones U.S. Commodity Chemicals Index ($DJUSCC) typically performs well in March and April, gaining an average of 1.9% and 3.6%, respectively, over the past two decades. Technically, like many other areas of the market, February was not particularly kind. Here's how the chart looks as we enter a seasonally strong period:
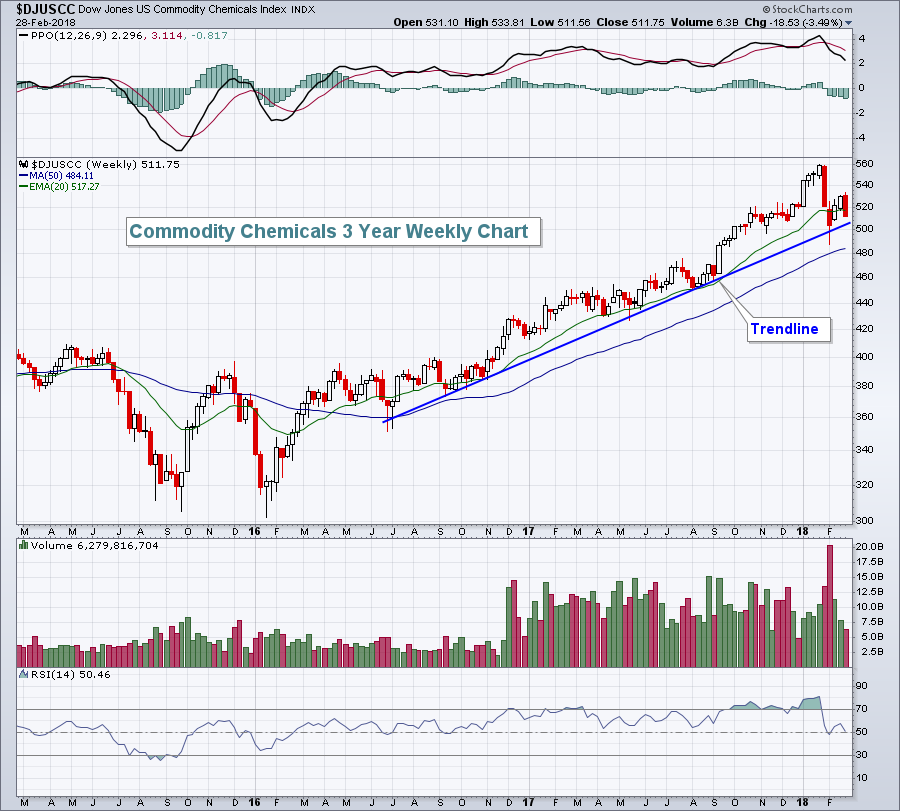 Yesterday's 2.36% decline capped off a rough month for the DJUSCC, but seasonal tailwinds remain in an industry group that remains solidly in an uptrend. Eastman Chemical (EMN) is a stock in this index that also benefits from strong seasonal tendencies beginning in March. More on that in the Historical Tendencies section below.
Historical Tendencies
Eastman Chemical (EMN) is one of the better performing S&P 500 stocks as Spring arrives. During March and April, EMN boasts average monthly gains of 4.1% and 7.9%, respectively, over the last 20 years. That's an average (!) 13.0% gain in 2 months since before the turn of the century. It's at least something to consider. Technically, EMN is outperforming its peers in commodity chemicals as it recently broke out to a fresh all-time high before the selling the past two days. Here's the chart:
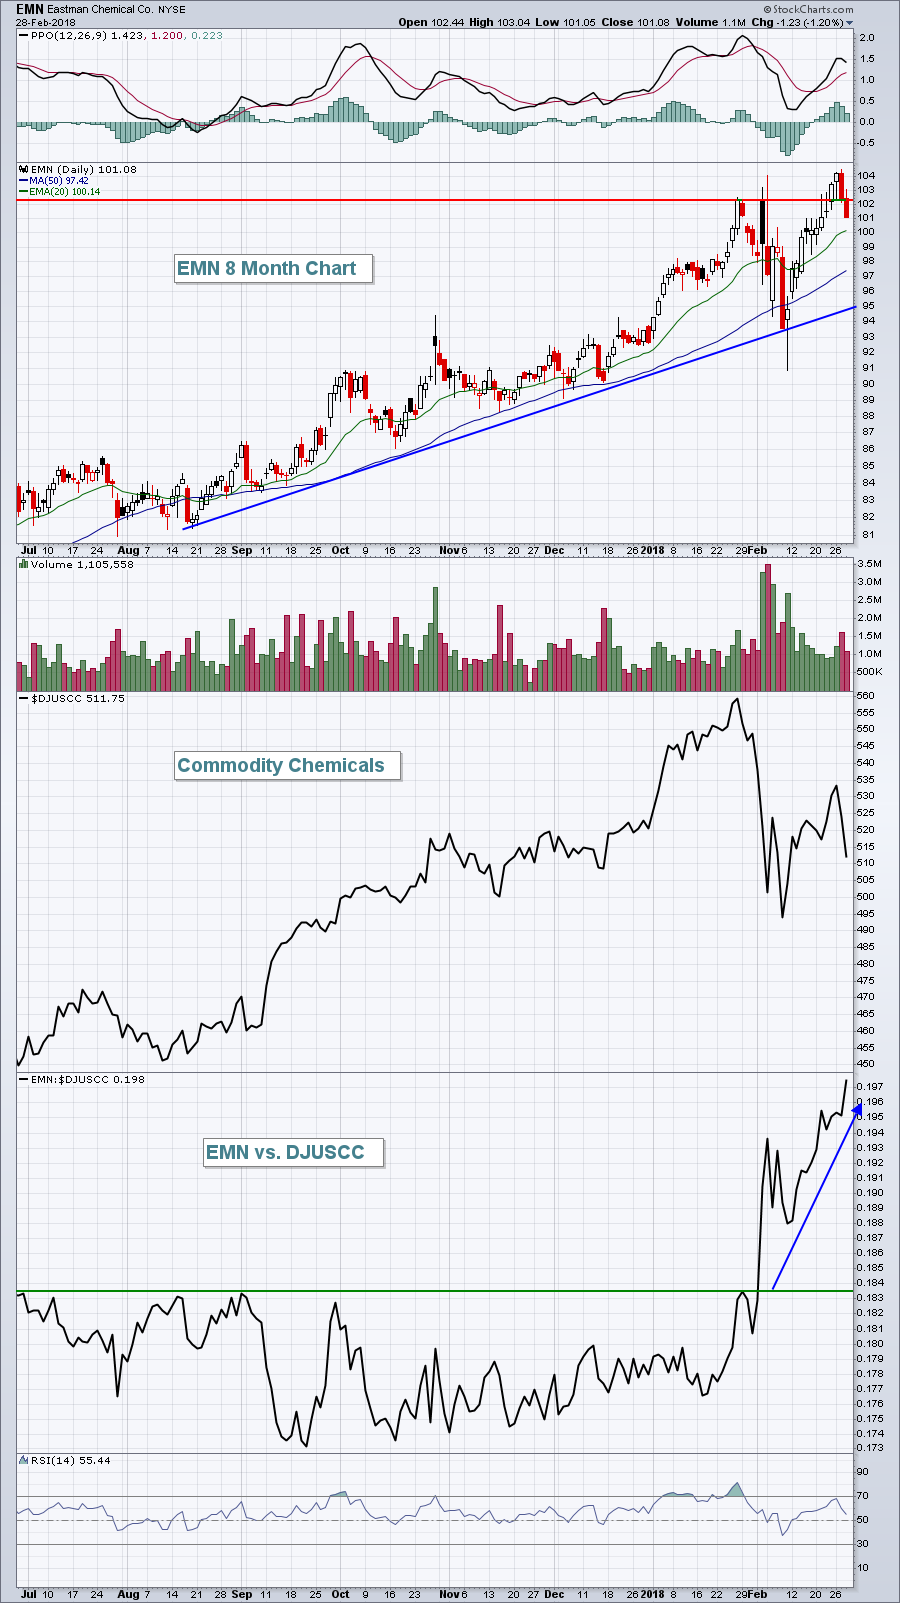 EMN is an outperforming stock in an outperforming industry with strong seasonal tailwinds perhaps ready to launch it higher.
Do you like this type of market and stock analysis? If so, please consider subscribing below if you haven't already. Once subscribed, you won't have to search for my blog articles. They'll be sent to the email address provided at the moment my article is published! It's also the only way I know you enjoy my blog. Simply scroll to the bottom of this article, type in your email address and click the green "Subscribe" button! It only takes a second, it's completely FREE, you won't be spammed and it helps me! It's a win-win-win-win! Thanks, as always, for your support! :-)
Also, be sure to tune in to MarketWatchers LIVE every day the stock market is open. I host (along with Erin Swenlin) an action-packed 90 minute show (12:00pm-1:30pm EST) right here at StockCharts.com. We feature an in-depth market analysis, rotating segments, the 10 in 10 segment (a fan favorite!) where I illustrate how to annotate your requested charts in the blink of an eye (ok, maybe two blinks), and interviews of leading TA experts all around the globe! Yesterday, Marc Chaikin (think Chaikin Money Flow) joined us at MW LIVE for a lively discussion on the markets, relative strength, institutional buying and selling, and gave us a "How To" demonstration for selecting stocks for long and short positions. It was a great show and you can watch a replay here at SC.com by CLICKING HERE! Once the archived show (only saved for 24 hours) is gone, you can find it at YouTube. Go to youtube.com and type in "StockCharts" in the search box. Click on the StockCharts logo and it'll take you to our youtube.com page. Scroll down to "MarketWatchers LIVE", find the show you'd like to listen to, click it and VOILA!
Key Earnings Reports
(actual vs. estimate):
BBY: 2.42 vs 2.05
BUD: 1.00 vs .98
CNQ: .42 vs .32
KSS: 1.87 vs 1.77
TD: 1.25 vs 1.17
(reports after close, estimate provided):
GPS: .59
NKTR: (.38)
SPLK: .34
VMW: 1.63
Key Economic Reports
Initial jobless claims released at 8:30am EST: 210,000 (actual) vs. 230,000 (estimate)
January personal income released at 8:30am EST: +0.4% (actual) vs. +0.3% (estimate)
January personal spending released at 8:30am EST: +0.2% (actual) vs. +0.2% (estimate)
February PMI manufacturing to be released at 9:45am EST: 55.7 (estimate)
February ISM manufacturing to be released at 10:00am EST: 58.6 (estimate)
January construction spending to be released at 10:00am EST: +0.3% (estimate)
Happy trading!
Tom
