Note
I write an article here in this blog each and every morning that the stock market is open. It's typically published during pre-market action, between 8:30am-9:00am EST. I've been doing it since September 2015 and I do my best to keep you up-to-date on what's truly important in the stock market. If you'd like to make sure you receive this information timely, please subscribe below if you haven't already. Simply scroll down to the bottom of my article, type in your email address and click the green "Subscribe" button. My articles will automatically be sent to your email address the moment they're published. It's 100% FREE and your privacy will not be compromised here at StockCharts.com.
Also, be sure to tune into StockCharts TV and catch my Market Watchers LIVE show with Erin Swenlin. Our show airs every day the stock market is open from noon to 1:30pm EST.
Thanks for your support and happy trading!
Market Recap for Thursday, April 12, 2018
Financials (XLF, +1.75%) saw renewed strength on Thursday, ahead of key bank earnings reports this morning, to close back above its 20 day EMA for the first time in a month. Reclaiming 20 day EMAs is definitely Job 1 for the bulls hoping to see a return to all-time highs. Some areas of the market have already done so, but most have not. This is a tremendous opportunity for the bulls to re-establish strength. A breakout in the XLF and solid bank earnings reports "should" lead to more buying, but let's keep an eye on what's most important - the chart:
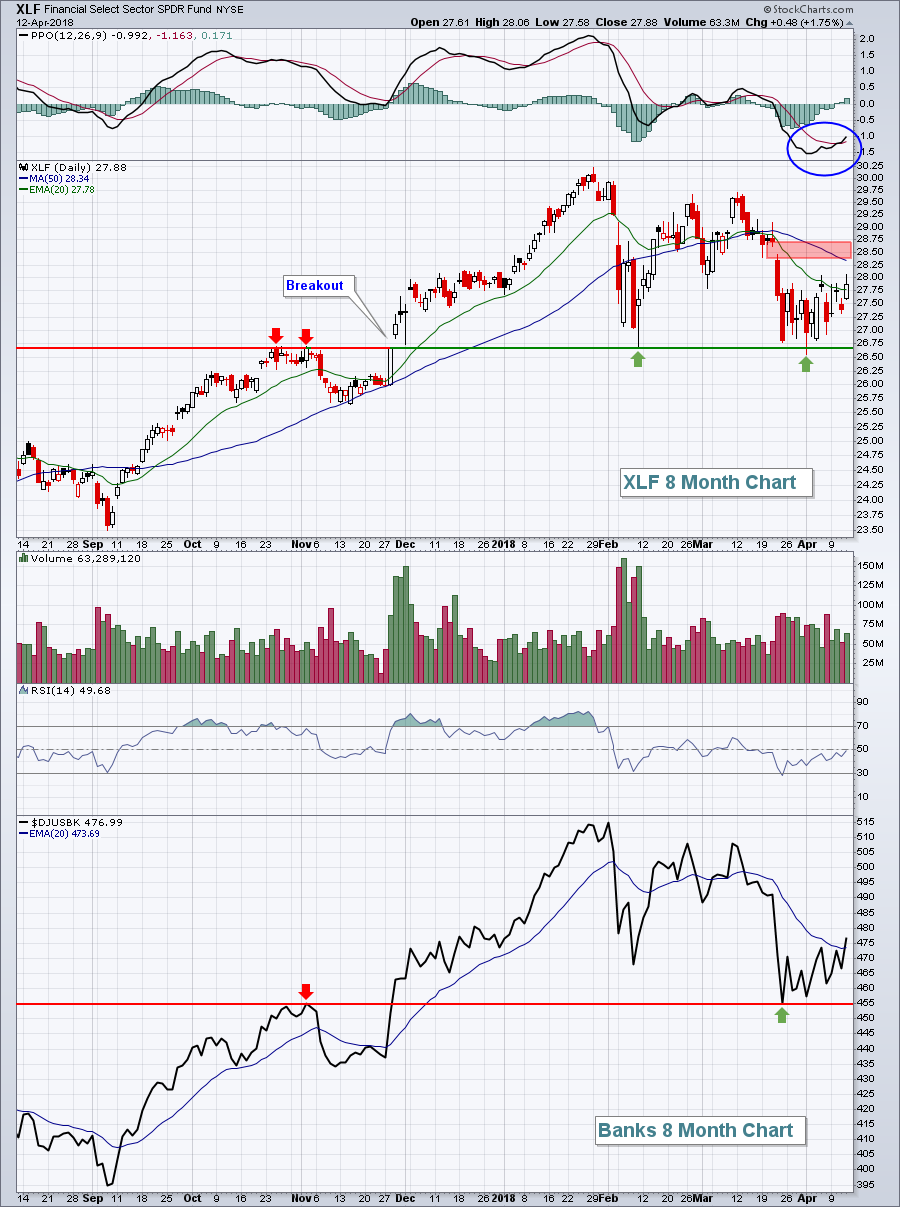 Now that we've cleared the 20 day EMA and we're seeing solid futures after strong bank earnings reports, I'm turning my attention to gap resistance (red shaded area) as the next obstacle for the bulls. Consolidation is a process and the process may not be over, but clearly the clouds are beginning to break up.
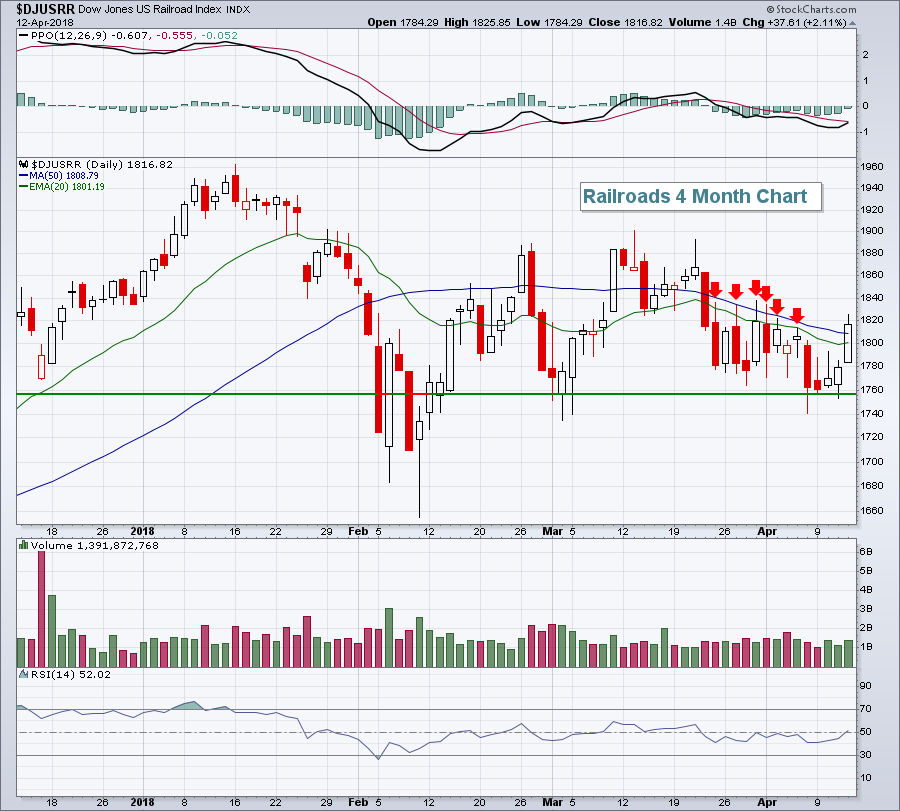
Industrials (XLI, +1.44%) were also quite strong on Thursday, with leadership from transports ($TRAN). Airlines ($DJUSAR, +2.45%), railroads ($DJUSRR, +2.11%) and trucking ($DJUSTK, +1.43%) ranked 1st, 3rd and 6th among the 16 industry groups in the sector. Of these transportation groups, the advance in railroads was perhaps the most notable technically as its 20 day EMA was cleared after days of failures:
 Energy (XLE, -0.01%) was flat after its recent breakout and the two defensive sectors - utilities (XLU, -1.32%) and consumer staples (XLP, -0.15%) failed to participate in Thursday's rally.
Pre-Market Action
All of the major banks reporting earnings this morning (JPM, C, PNC, WFC) beat Wall Street estimates as to EPS. This strength in banks is helping Dow Jones futures this morning, which are currently higher by 138 points with just over 30 minutes left to today's opening bell.
Current Outlook
Over the past year, the four best performing sectors are:
Technology (XLK, +28.39%)
Financials (XLF, +22.14%)
Consumer Discretionary (XLY, +18.30%)
Industrials (XLI, +17.20%)
The two worst?
Consumer Staples (XLP, -2.42%)
Utilities (XLU, -1.56%)
The four best are the four "aggressive" sectors. Earnings tend to rise and fall much more quickly in these areas and, for that reason, money rotates into these sectors when a strengthening economy is expected in the months ahead. The opposite is true as the stock market tops and economic weakness approaches.
At the S&P 500 high close on October 9, 2007, here is how the sector leaderboard lined up in terms of one year performance:
Technology (XLK, +23.80%)
Financials (XLF, +2.00%)
Consumer Discretionary (XLY, +4.65%)
Industrials (XLI, +22.61%)
The defensive sectors?
Consumer Staples (XLP, +11.33%)
Utilities (XLU, +20.73%)
I've highlighted in bold the performance of consumer stocks. Consumer spending represents roughly two-thirds of our GDP so it's always important to see where investors are placing their bets in the consumer space. In 2007 - at the market top - consumer investment turned extremely defensive as the XLP had outperformed the XLY in the year leading up to the market top by a +11.33% to +4.65% margin.
Over the last year, there's a completely different mindset, with the XLY wildly outperforming the XLP by a margin of +18.30% to -2.42%. If we're looking at a recession ahead and a potential bear market, someone forgot to send a memo to traders in the consumer space.
Sector/Industry Watch
Let's look visually at what that consumer investing strategy looks like now vs. what it looked like at the market top in 2007:
Current:
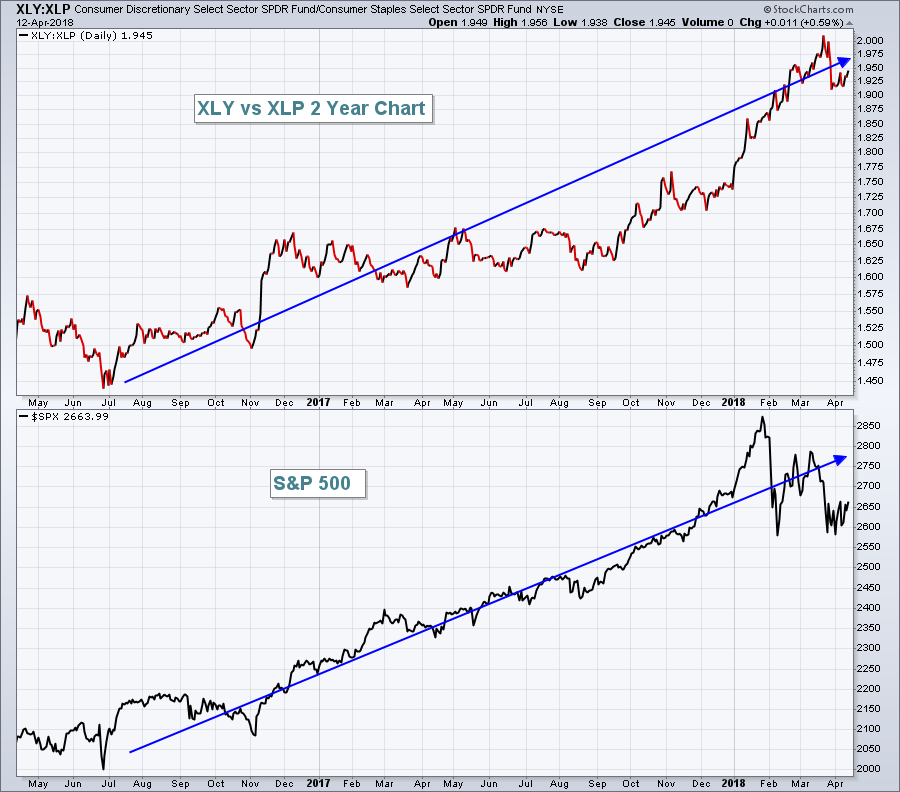 The XLY:XLP ratio plotted on this chart provides the visual of what I discussed earlier with all the one year performance numbers. The XLY is attracting the majority of the consumer stock investment dollars and that's reflected with a rising ratio on this chart. Do you want to see what "Houston, we've got a problem" looks like?
2007:
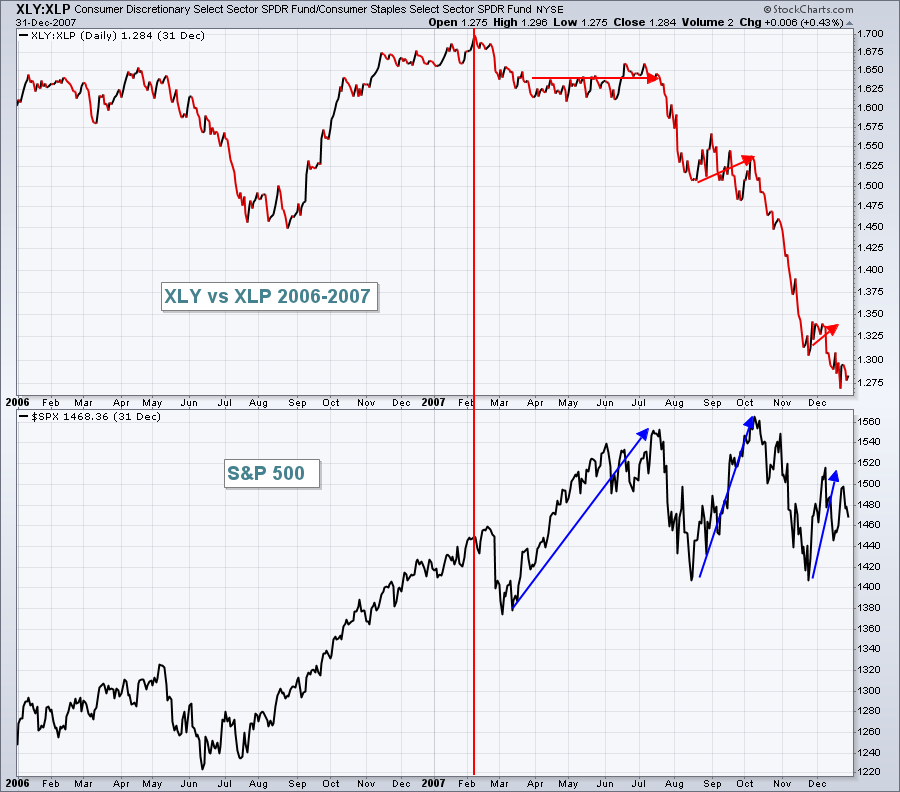 Do you see the difference? The S&P 500 was setting a brand new all-time in 2007 just as it did recently in January 2018. But the composition of the rally was completely altered in 2007. If consumer spending is 2/3 of our GDP, do you really want to see consumer staples leading the charge? 2007 is a perfect example of NOOOOO!!!
Keep in mind that the XLY:XLP ratio typically drops during market selloffs. That's normal behavior. It's when stocks rally to new highs and the XLP leads the XLY during those rallies that we need to be aware of. CNBC won't tell you that. Instead, they'll have their pom poms out celebrating the new S&P 500 highs.
Historical Tendencies
The Dow Jones U.S. Nondurable Household Products Index ($DJUSHN) hit more than a two year low in March and, after a brief rebound, is on the move lower again. It's only risen 32% of Aprils over the last 19 years and April is its second worst month of the year in terms of relative performance (averages losing 1.6% vs. the S&P 500 in April). Its worst? March (-2.2%).
Kimberly Clark (KMB) and Clorox (CLX) are two of the better known companies in the DJUSHN and they currently sport SCTRs of 12.9 and 19.9, respectively.
Key Earnings Reports
(actual vs. estimate):
C: 1.68 vs 1.61
INFY: .26 vs .25
JPM: 2.37 vs 2.28
PNC: 2.43 vs 2.42
WFC: 1.12 vs 1.07
Key Economic Reports
April consumer sentiment to be released at 10:00am EST: 101.0 (estimate)
Happy trading!
Tom
