Market Recap for Tuesday, April 10, 2018
It seems like forever, but the energy sector ETF (XLE, +3.31%) finally did it - it closed above 69.00! Can we please say goodbye to the 66-69 trading range? I didn't realize this until yesterday, but the XLE's SCTR is now at 78.6, trailing only technology's (XLK, +2.46%) and consumer discretionary's (XLY, +1.21%) SCTR scores of 86.2 and 85.8, respectively. Based on the following chart, we are likely to see further relative strength in the XLE:
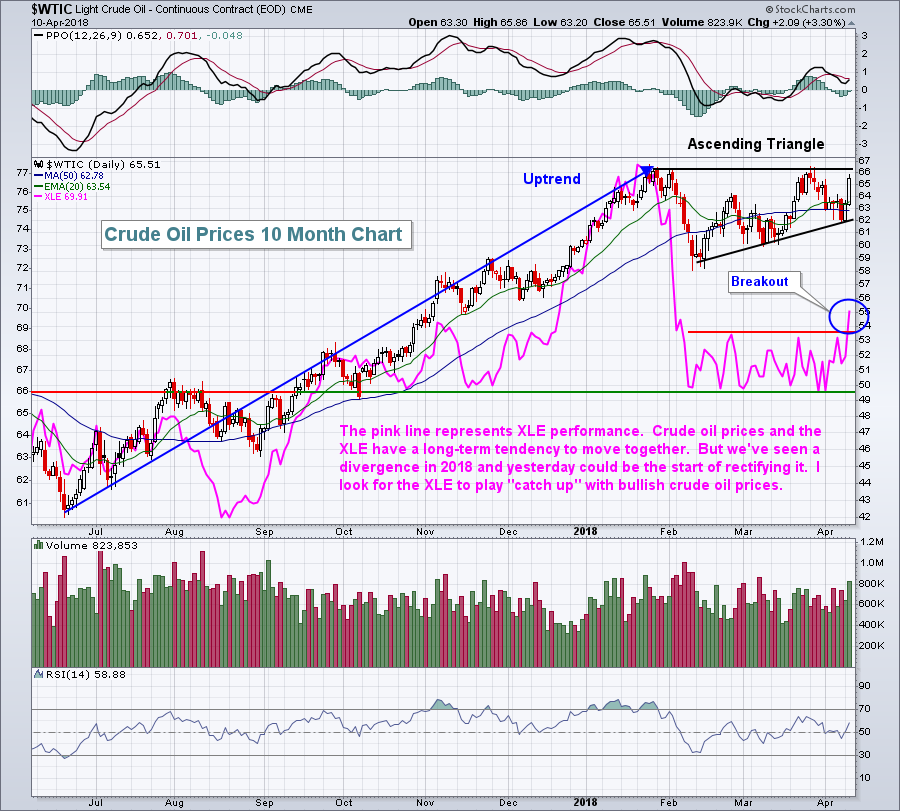 If you pull up a long-term weekly chart and use the correlation indicator, you'll see that the XLE and WTIC move mostly in unison with one another. The XLE breakout on Tuesday could resume that historical correlation after a pause the past two months. Furthermore, crude oil prices are in a very bullish ascending triangle pattern that suggest higher prices ahead and that's yet another argument to be invested in the XLE.
Exxon Mobil (XOM), Chevron (CVX) and Schlumberger (SLB) comprise close to 50% of the XLE. All three stocks performed exceptionally well yesterday, but CVX is showing relative strength as it emerges as a leader for the XLE:
 The green shaded area highlights the golden cross (20 day EMA crossing above 50 day SMA). This has not occurred on XOM or SLB (or the XLE), so CVX is clearly showing nice relative strength. I expect we'll continue to see relative strength on CVX.
In my opinion, much of the trade war headlines is just talk. Global trade negotiations occur often and nothing has been settled between the U.S. and China. Media outlets, however, need to sell ads and generate ratings so they take every headline and blow it out of proportion to generate the fear required to increase ratings and sell ads. Note the many instances that the stock market gaps up or down on the headline news, then trades in the opposite direction throughout the trading day. Let's continue to watch what really matters - money flow, support, resistance, etc.
Pre-Market Action
Today, the negative headlines center around Syria. Media outlets need to diversify too. When the inflation hype and trade war hype begin to lose steam, they need to find something else to generate interest. Enter Syria. Dow Jones futures have responded by falling more than 200 points with less than an hour left to the opening bell.
Money is rotating into bonds this morning, with the 10 year treasury yield ($TNX) dipping to 2.77%. Gold ($GOLD) is up 0.55% today and resides at $1353 an ounce, closing in on very important resistance just above $1360. Crude oil ($WTIC) is up 1% and threatening an ascending triangle breakout, which would be very good news for XLE bulls.
Asian markets were mixed overnight, but the selling is uniform in Europe this morning with the German DAX ($DAX) retreating nearly 1%.
Current Outlook
Technology (XLK) still remains the best performing sector, although consumer discretionary (XLY) is close and energy (XLE) is improving. Looking at an hourly chart of the XLK, recent strength does look promising, but the question is......will today's renewed pre-market selloff trigger another down channel? The last one just ended as you can see below:
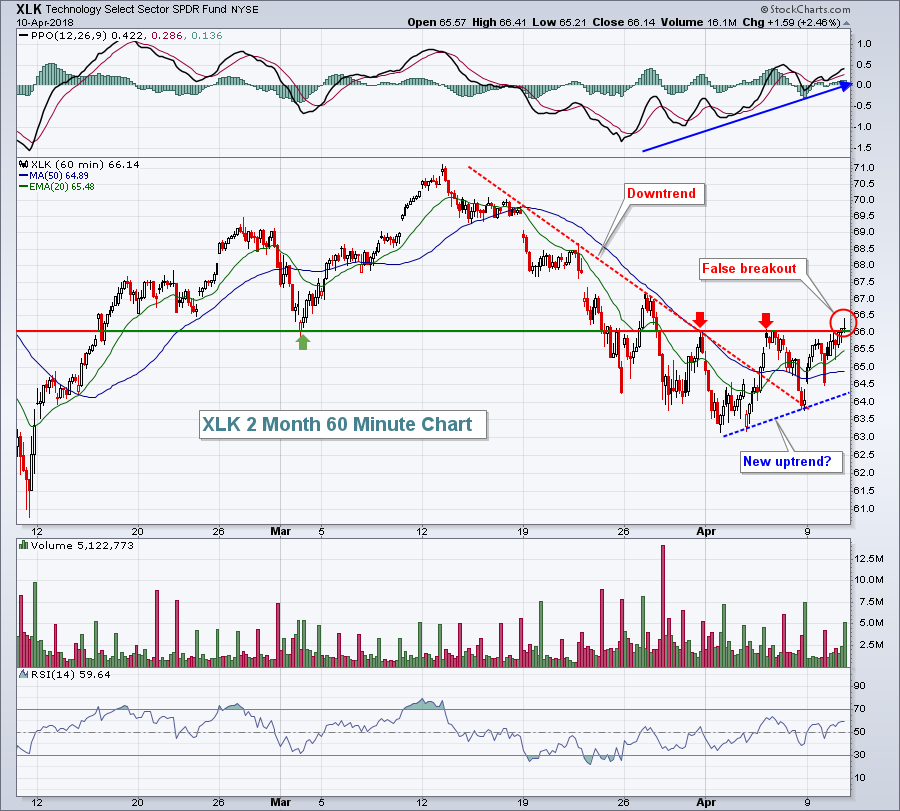 We tend to look to the very aggressive technology sector for leadership and directional cues. We had begun to see strength building, but a solid confirmed close above 66 would provide a much-needed boost to traders' confidence. We did manage to close at 66.14, a minor victory, but you can see the failure (red circle) late in the day after the XLK hit 66.41. A move back through 66.41 would be bullish.
Sector/Industry Watch
Oil equipment & services ($DJUSOI) led the energy advance on Tuesday, rising 4.77%. There's still work to be done here, but with crude oil higher this morning and looking to break out of a very bullish ascending triangle pattern, it seems that it's not a question of "if" the DJUSOI will break price resistance, it's "when":
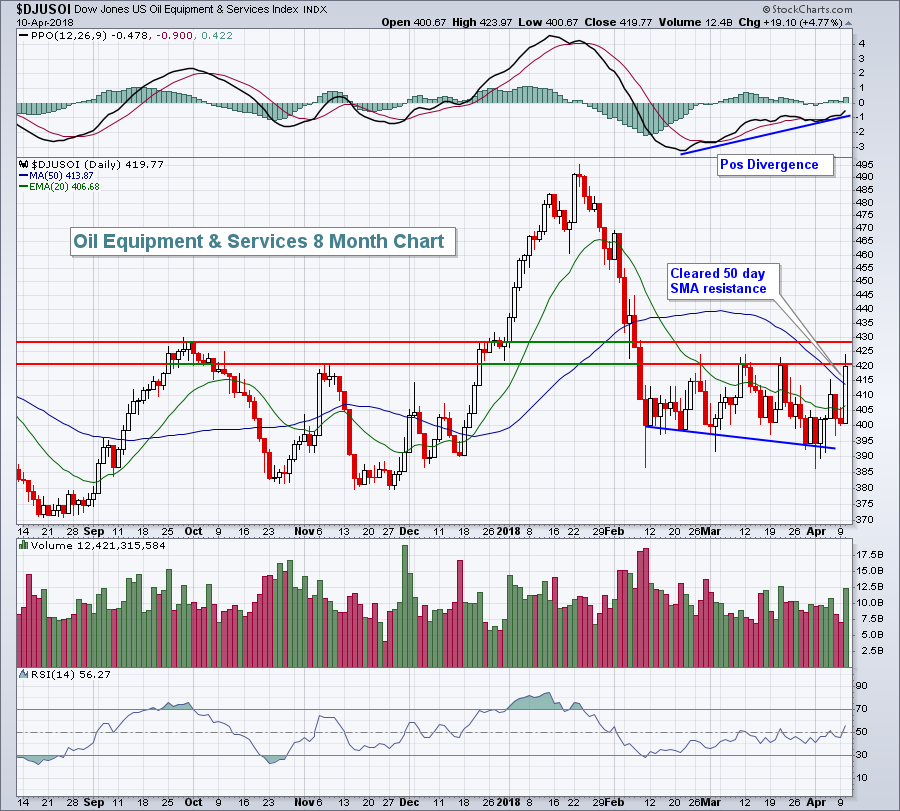 There are two levels of price resistance, the first of which is just above the 420 level. Then comes the price resistance that we saw during the September 2017 rise just below 430. So if the DJUSOI can negotiate the 420-430 resistance zone, I'd look for accelerating strength and eventually a test of the January high at 495. That's a solid potential advance that's worth keeping an eye on.
Historical Tendencies
There's no denying that the S&P 500 enjoys April. It's risen during the month of April 48 times and lost ground only 20 times over the past 68 years. The S&P 500 has produced annualized returns of 17.06% during this period and that's nearly double the 9% average annual returns. But most of the historical strength has been enjoyed from April 1st through the 18th. The 19th through the 28th has produced annualized returns of -0.45% before strength returns the last two calendar days of the month.
This doesn't mean the S&P 500 will not advance after April 18th. If technicals suggest otherwise, I'll follow the technicals. But the "odds" favor the bears after April 18th. That gives the bulls another week to try to clear 20 day EMA resistance with gusto. Yesterday's close of 2656.87 did clear the 20 day EMA (currently 2655.91), but it's difficult to get excited when it's cleared by less than 1 point.
Key Earnings Reports
(actual vs. estimate):
FAST: .61 vs .61
Key Economic Reports
March CPI released at 8:30am EST: -0.1% (actual) vs. +0.0% (estimate)
March Core CPI released at 8:30am EST: +0.2% (actual) vs. +0.2% (estimate)
Happy trading!
Tom
