Reminder
If you like my daily Trading Places blog articles and you haven't done so already, please subscribe below. It's a great feature that StockCharts.com provides for all of the blogs here, and it's FREE and easy. Simply scroll to the bottom of this article (or any other blog author's article), type in your email address and hit the "Subscribe" button. You'll then receive my articles each day the stock market is open as soon as they're published! Thanks for your support!
Market Recap for Tuesday, May 15, 2018
There are several themes emerging in terms of 2018 investment strategies and another one emerged yesterday. The 10 year treasury yield ($TNX) closed at 3.08%, its highest close in the past 7 years. It's very significant in my view because it's occurred after a double bottom printed and it sure seems to be giving us a signal like we haven't seen in 35-40 years. In my opinion, we are now in a rising interest rate environment. I'm not talking short-term or intermediate-term. I believe the multi-decade, long-term decline in interest rates is over. Done. Kaput. Here's the visual technical proof:
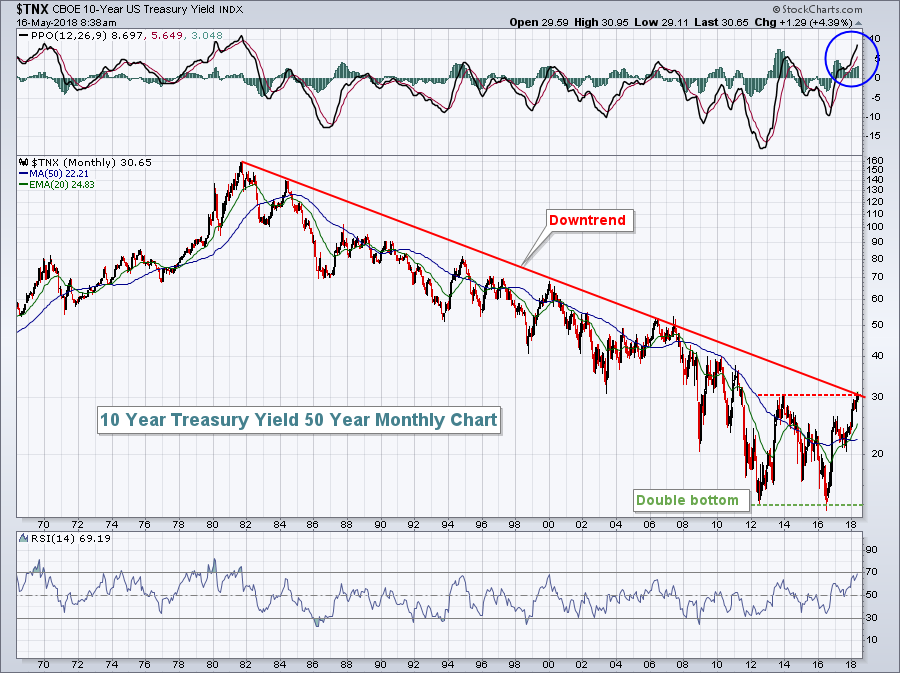 Is this a head fake? It's certainly possible, but now that we've seen a technical breakout, think about the fundamental environment. The Fed's balance sheet is bloated with treasury assets purchased during the period of quantitative easing. They need to sell at some point. That selling will result in lower treasury prices and higher yields. The key will be whether the economic strength here in the U.S. is strong enough to sustain such interest rate movements. I don't have the answer for that, but stock market rotation suggests we're still fine. Few are strategizing like we're heading for stock market armageddon so I won't either.
But there are effects that we should immediately recognize. U.S. interest rates are increasing faster than our foreign counterparts. That will continue to put a bid under the U.S. Dollar ($USD). The rising dollar should provide a boon to small cap stocks as the U.S. economy strengthens and money rotates away from the multinational companies found on the Dow Jones and S&P 500. That rotation has already begun in major fashion:
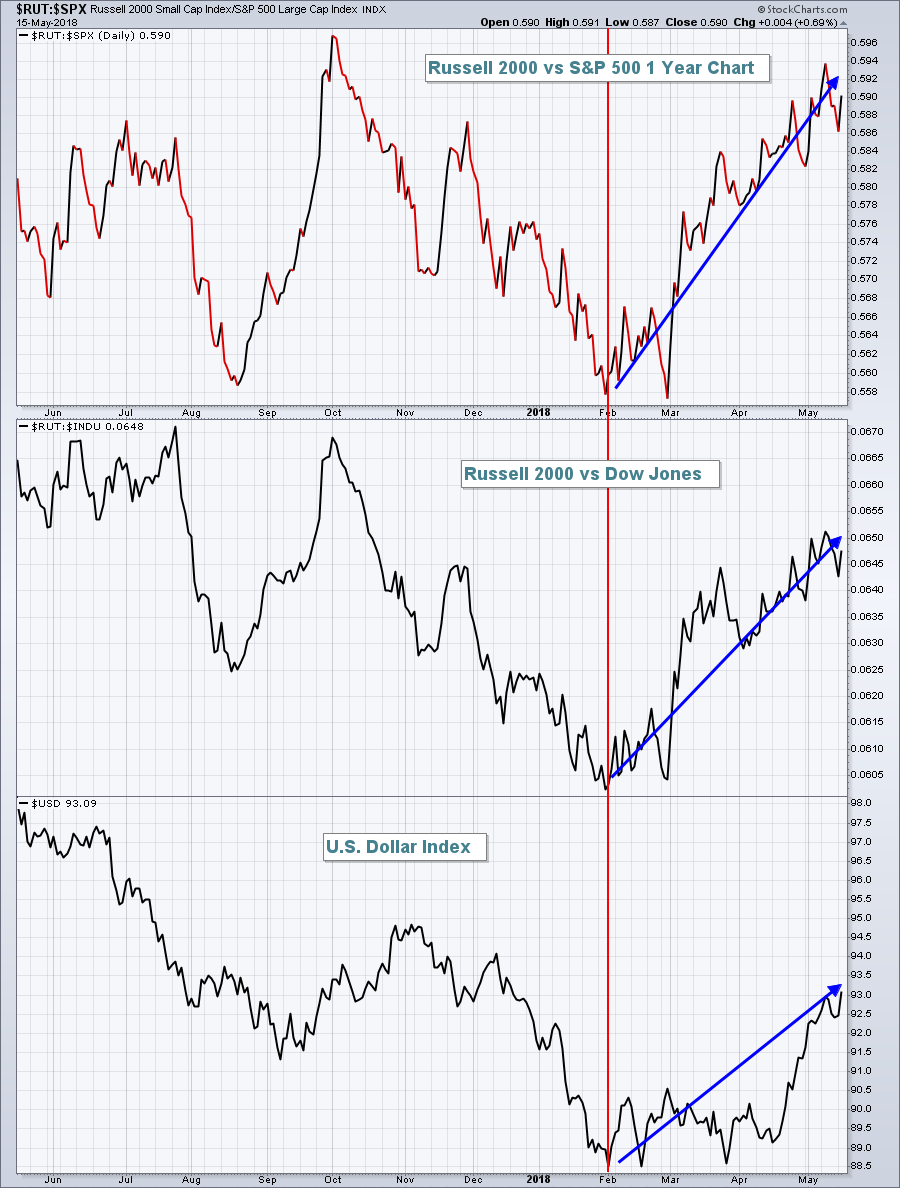 Small caps have begun to dominate and currently reside just beneath a major breakout to an all-time high. That occurs when the Russell 2000 closes above 1611. Watch for it.
From a sector perspective, energy (XLE, +0.03%) was the only sector to finish in positive territory. Financials (XLF, -0.18%) tend to perform well when rates are rising and key areas like life insurance ($DJUSIL, +0.47%) and banks ($DJUSBK, +0.15%) did move higher, but REITs ($DJR, -1.62%) were a major drag as their dividends do not look nearly as attractive when treasury yields are rising. Utilities (XLU, -0.84%) struggled during Tuesday's session for the same reason.
Home construction stocks ($DJUSHB, -5.63%) were crushed as the 10 year treasury yield pushed to 7 year highs. Home improvement ($DJUSHI, -1.49%) also suffered based on the higher rates and Home Depot's (HD, -1.62%) disappointing same-store sales, which fell for the first time in 7 quarters. More on home construction in the Sector/Industry Watch section below.
Pre-Market Action
The oversold bond market is getting a bounce this morning with the 10 year treasury yield ($TNX) falling back to 3.05%. The impact of rising treasury yields is very significant so it's important to continue to follow developments here.
Gold ($GOLD) made a major breakdown recently beneath the $1300 per ounce support level and it's down another $4 this morning to $1286. I don't like gold and haven't liked it since it broke down vs. the S&P 500 back in 2011. I continue to believe there are better places for your money.
Asian markets were down overnight, but Europe is modestly higher as the German DAX ($DAX) is trading slightly above 13000. Dow Jones futures are pointing to a lower open, down 26 points with less than 30 minutes to the opening bell.
Current Outlook
Rising treasury yields are a glass half-full vs. half-empty kind of thing. Unless yields are rising to combat inflation or are already too high, I view rising yields as a very bullish development for equities. Why? Well, treasury yields typically rise as economic conditions improve or are expected to improve. Bond values decline in a rising rate environment as they're sold off. The proceeds of those sales generally are reinvested in equities as improving economic conditions result in higher profits for corporations. Check out this chart:
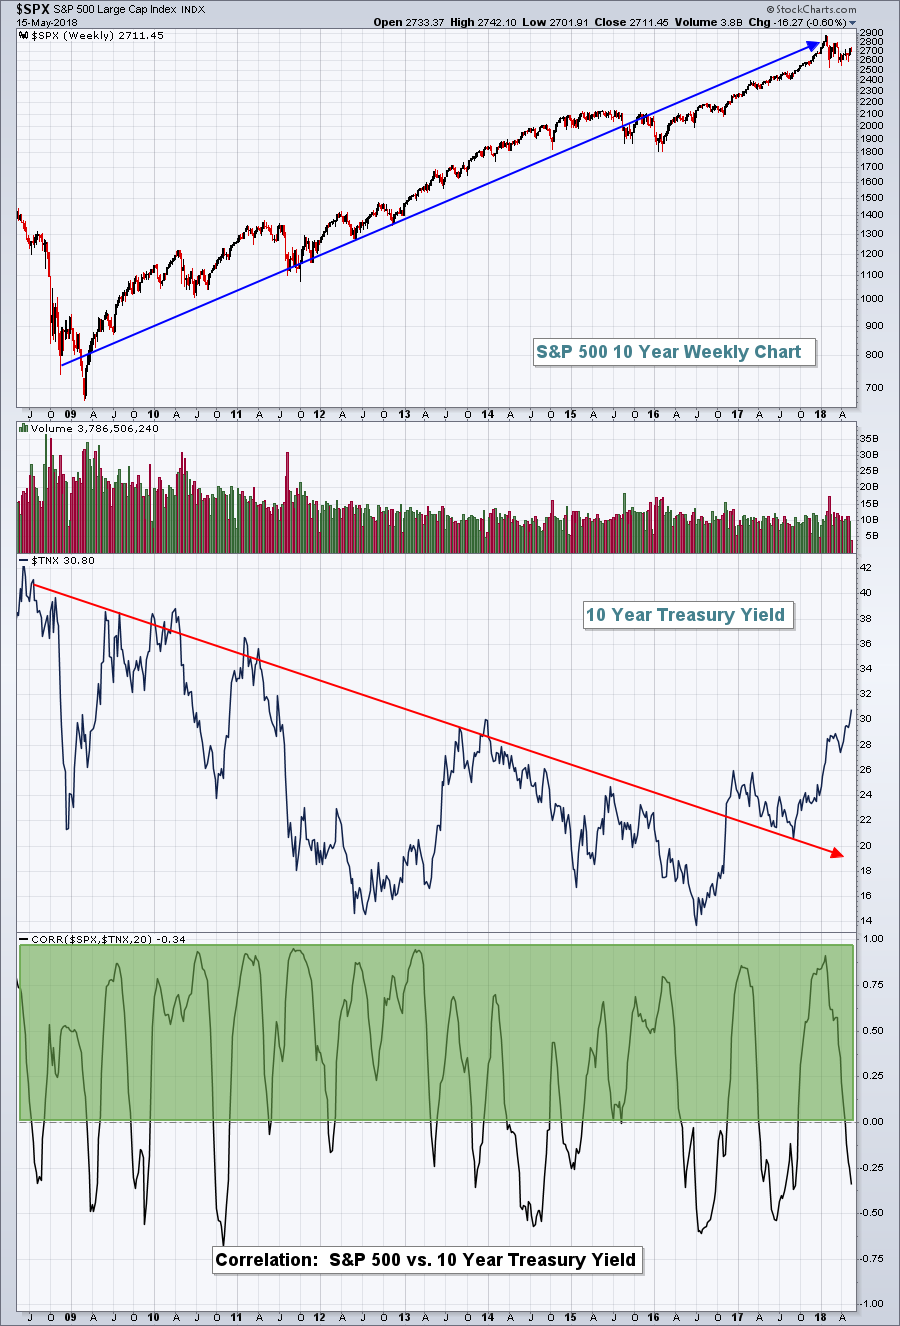 At first glance, you might think there's a negative correlation as the S&P 500 has been rising for the past decade while the 10 year treasury yield has mostly been declining. So how can the correlation be mostly positive (green shaded area above)? Think of the correlation as short- to intermediate-term rotation. Over long periods of time, lots of new money pours into both the stock and bond markets. Treasury yields move opposite of treasury prices. So as new money pours into treasuries, yields decline. As money rotates from bonds (selling of bonds) to equities, yields rise. It's the combination of new money and rotating money that drives treasury and equity prices.
Portfolio managers and traders alike have an important decision to make in the near-term. How much money do I allocate to bonds and how much to equities? It's this short-term decision that drives the correlation in the chart above. As economic conditions improve, money rotates away from bonds and into stocks. The money moving out of bonds drives yields higher. Therefore, we see yields and equities move in the same direction in the short-term, resulting in the mostly positive correlation that we see in the chart above.
The 10 year treasury yield closed at 3.08% on Tuesday due to strong economic conditions. I believe that same economic strength will result in higher stock prices.
Sector/Industry Watch
Is there a downside to higher treasury yields? Of course. Interest-sensitive stocks can either ride the wave or be crushed by a tsunami. The Dow Jones U.S. Home Construction Index ($DJUSHB) saw the latter on Tuesday. Mortgage rates tend to follow the 10 year treasury yield so the TNX breaking out to 7 year highs spooked those holding home construction, homebuilding and home improvement ($DJUSHI) stocks. I am of the belief that interest rates remain extraordinarily low and that the DJUSHB will recover, but the short-term breakdown is obvious:
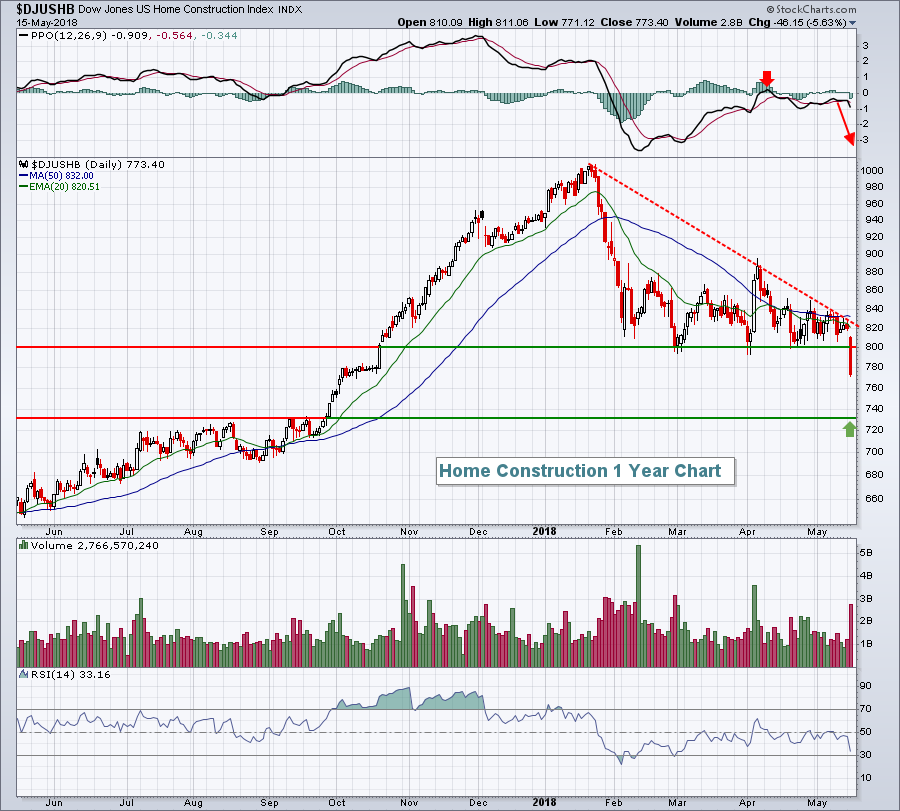 Check out the volume on this breakdown. It was heavy and we must respect this type of selling. I would not be surprised at all to see the DJUSHB test price support near 730 (green arrow). Momentum failed at the PPO centerline (red arrow) and the PPO now appears to be rolling over and heading lower as selling momentum accelerates. I'd avoid the group for now, but wait patiently for a solid reward to risk entry down the road.
Historical Tendencies
Two of the best three seasonal performers have been helping to carry the market higher in May. Internet ($DJUSNS) and toy ($DJUSTY) stocks have ranked #2 and #3 of all industry groups in terms of May performance over the past two decades, averaging gaining 3.6% and 3.4%, respectively, over that time span. Thus far in May 2018, both industries have soared with the DJUSNS rising 6.23%, while the DJUSTY has done even better, gaining 7.24%.
What has the #1 performing May industry group done? Well, that would be tobacco ($DJUSTB) and its weak chart continues to haunt the group. It's been down 2.67% and not participating in this month's nice rally. There is a silver lining, however, as the DJUSTB is currently printing a positive divergence. A reversing candle could signal a quick 8-10% rally, so keep an eye out for that.
Key Earnings Reports
(actual vs. estimate):
M: .48 vs .36
TCEHY: .30 vs .31
(reports after close, estimate provided):
CSCO: .65
NTES: 2.40
TTWO: .64
Key Economic Reports
April housing starts released at 8:30am EST: 1,287,000 (actual) vs. 1,324,000 (estimate)
April building permits released at 8:30am EST: 1,352,000 (actual) vs. 1,350,000 (estimate)
April industrial production to be released at 9:15am EST: +0.6% (estimate)
April capacity utilization to be released at 9:15am EST: 78.3% (estimate)
Happy trading!
Tom
