Market Recap for Monday, June 25, 2018
We ended a bearish historical period yesterday with.....well.....bearishness. It was an ugly start to the day on more trade threats and, with an hour left in the session, the Dow Jones was down nearly 600 points. Buyers did emerge in that final hour, almost slicing the Dow's losses in half, but it was still a nasty day for bulls. Defensive bonds did well, as did defensive sectors. Utilities (XLU, +1.66%) and consumer staples (XLP, +0.50%) managed to ignore the selling and post gains, but the rest of the market didn't fare so well. The NASDAQ and Russell 2000 posted losses of 2.09% and 1.67%, respectively, as consumer discretionary (XLY, -2.17%), technology (XLK, -2.08%) and energy (XLE, -2.01%) were all extremely weak. In the case of the former two, it was the worst day either had seen over the past two months.
Carnival Corp (CCL, -7.95%) lowered its EPS guidance for Q3 and its fiscal year and that sunk cruise lines. CCL was the worst performing stock in the S&P 500, but it had plenty of company as both Norwegian Cruise Line Holdings (NCLH, -6.14%) and Royal Caribbean Cruises (RCL, -5.52%) suffered in sympathy. Recreational Services ($DJUSRQ) tumbled 5.57% to easily lead consumer discretionary to the downside and create more technical angst:
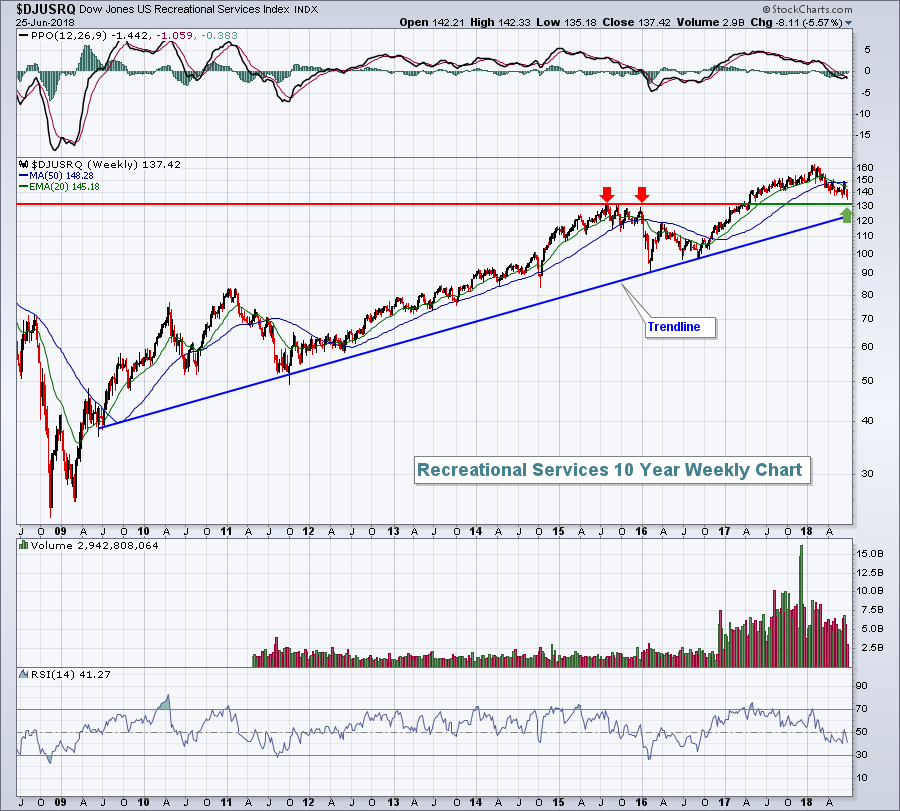 The long-term chart still shows an uptrend in play, but there's plenty of room down to key trendline and price support in the 125-130 area. Given the reduced guidance provided by CCL on Monday, there's a good chance that the DJUSRQ tests this support area, particularly if the overall market remains weak during the summer months.
The New York Post reported over the weekend that Kraft Heinz Co (KHC) might be interested in acquiring Campbell Soup Co (CPB). CPB soared on the news, gaining 9.40% and sitting atop the S&P 500 leaderboard. Defensive names like Kimberly Clark (KMB, +2.90%), Clorox (CLX, +2.79%) and Kellogg (K, +2.54%) littered that leaderboard, along with several utilities.
Pre-Market Action
Global markets calmed down after yesterday's selling. Asian markets were mixed this morning, while European markets were mostly higher. Gold ($GOLD) is under pressure once again, trading at $1257 per ounce at last check. That would mark GOLD's lowest close in 2018 as it rapidly approaches the December 2017 low near $1240 per ounce.
Lennar (LEN) posted strong quarterly results, easily exceeding Wall Street's estimates for revenues and EPS. LEN is up by 6% in pre-market trade.
With 40 minutes left to the opening bell, Dow Jones futures are flat.
Current Outlook
Short-term traders MUST grow cautious any time that the Volatility Index ($VIX) spikes as rapidly rising volatility is associated with serious price declines. A high VIX doesn't mean bear market, or even correction, but it does typically mean a quick selloff. Final tops in the last two bear markets began with VIX readings at 17 or above. In other words, Wall Street was already fearful and anticipating a bear market. Let's look at year 2000:
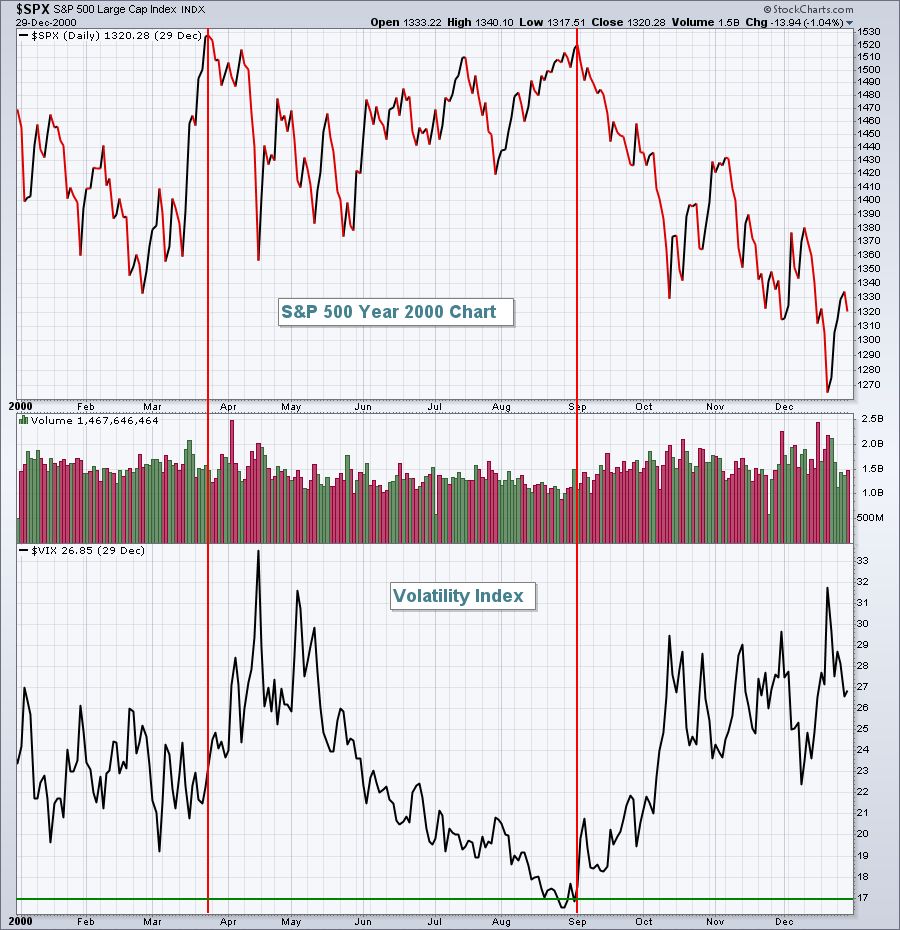 At the March 2000 high, the VIX was in the 20s, indicative of much fear among traders. During the final attempt at a breakout in September, the VIX fell to the 17 level, but failed there. The October 2007 high was similar:
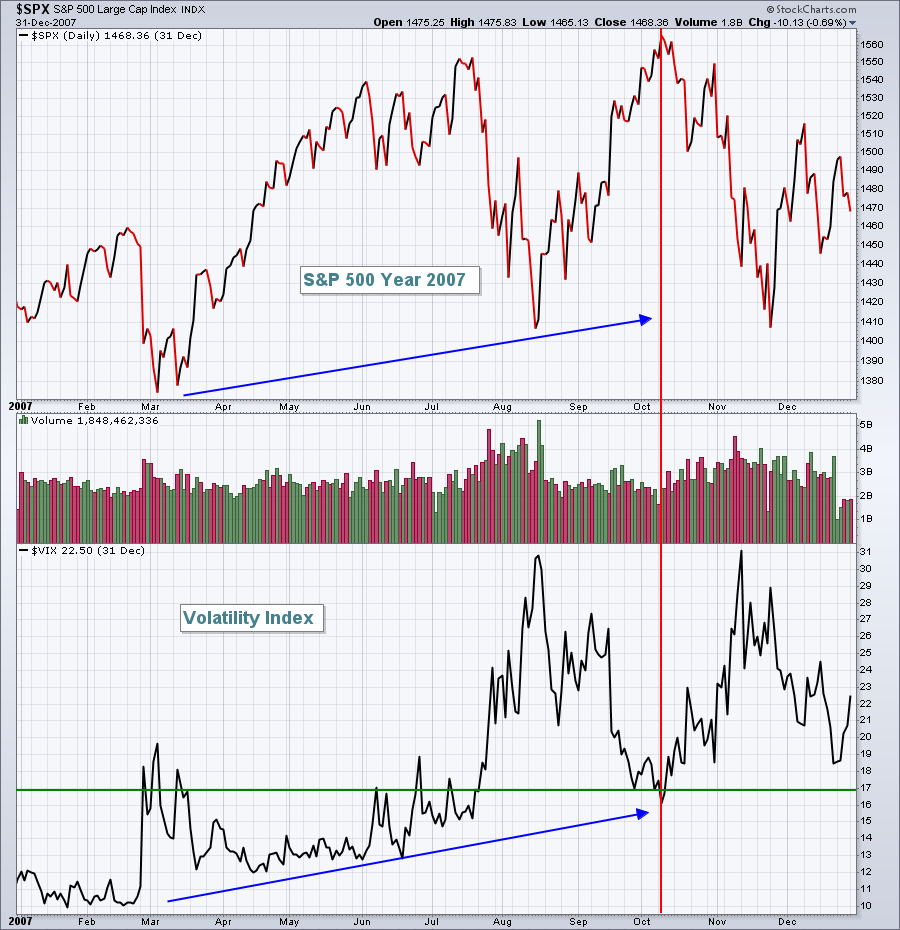 In 2007, the VIX broke above the 17 level in July as the S&P 500 made its final fateful rise into October. At the market top, note that the VIX had found a bottom at 16, just beneath that key 17 level. It's why I now refer to 16-17 as being critical support on the VIX as the S&P 500 rises. VIX moves beneath that level point to bull market action. VIX levels that remain above the 16-17 level send us a signal to be very, very careful.
Now let's check out 2018:
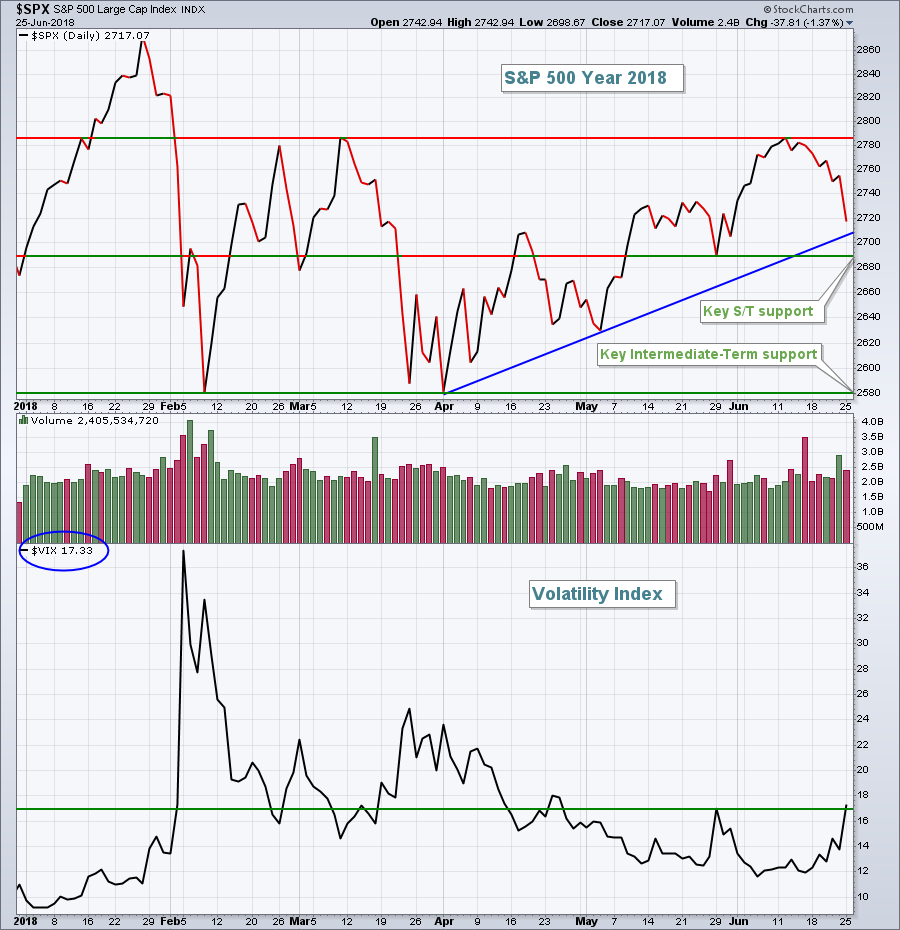 The VIX is just breaking above 17. While this is definitely a bearish short-term development for the U.S. stock market, it isn't a signal of an impending bear market. A VIX remaining above 16-17 support on S&P 500 advances would be a much bigger problem from a long-term perspective.
Sector/Industry Watch
We need to be careful as the more bearish summer time months have arrived. That, along with a VIX on the rise can result with additional sudden selling. Longer-term weekly charts of consumer discretionary (XLY) and technology (XLK) support the possibility of further summer weakness:
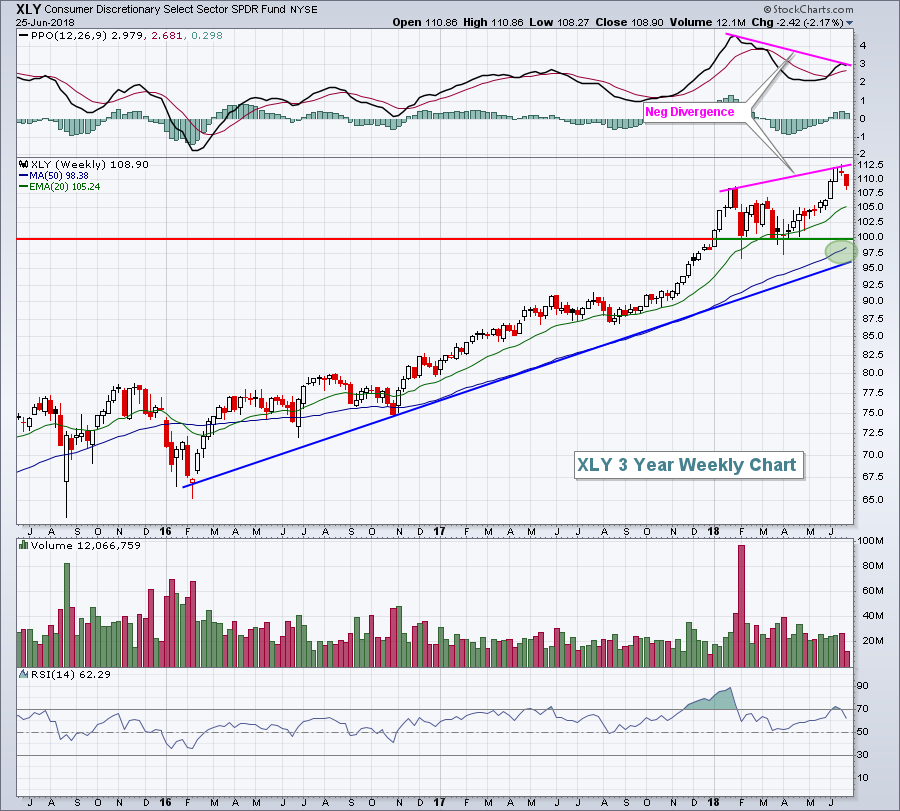 Only the XLY is shown above, but the XLK shows similar characteristics. First, there's a negative divergence on a weekly chart. That can signal several weeks of consolidation or selling. Divergences are not guarantees, however. I remain bullish, but open to the possibility of further summer consolidation. That means defensive posturing should be considered. A covered call strategy helps to reduce downside risk, but it can also limit your upside if the stock market resumes its longer-term bullish uptrend. I don't believe the S&P 500 will be in a runaway bull market this summer. If the dollar ($USD) breaks out, then small caps could see further relative strength, but I actually believe a stronger U.S. dollar will provide headwinds for the S&P 500.
Historical Tendencies
On MarketWatchers LIVE yesterday, Arthur Hill and I discussed several stocks on a seasonal basis. One in particular was Gilead Sciences (GILD), a biotechnology company. GILD has produced average monthly returns of +4.2%, +5.3% and +3.7% during June, July and August, respectively, over the past two decades. Biotechnology stocks ($DJUSBT) tend to perform quite well in the summer months.
Key Earnings Reports
(actual vs. estimate):
FDS: 2.18 vs 2.14
INFO: .61 vs .57
LEN: 1.58 vs .45
Key Economic Reports
April Case Shiller home price index to be released at 9:00am EST: +0.5% (estimate)
June consumer confidence to be released at 10:00am EST: 128.1 (estimate)
Happy trading!
Tom
