Market Recap for Thursday, July 12, 2018
Those looking for a bear market to develop were dealt a serious blow on Thursday as the NASDAQ forged to yet another all-time high. The Russell 2000 was on the verge of doing so earlier this week as it reached an intraday all-time high....but small caps couldn't sustain the strength into the close. The NASDAQ held it into the close, actually accelerating its gains into the close and did so on the heels of two familar industry groups - internet ($DJUSNS, +2.37%) and software ($DJUSSW, +2.2%). These two have shown super relative strength in 2018 and should be viewed as leaders worth owning:
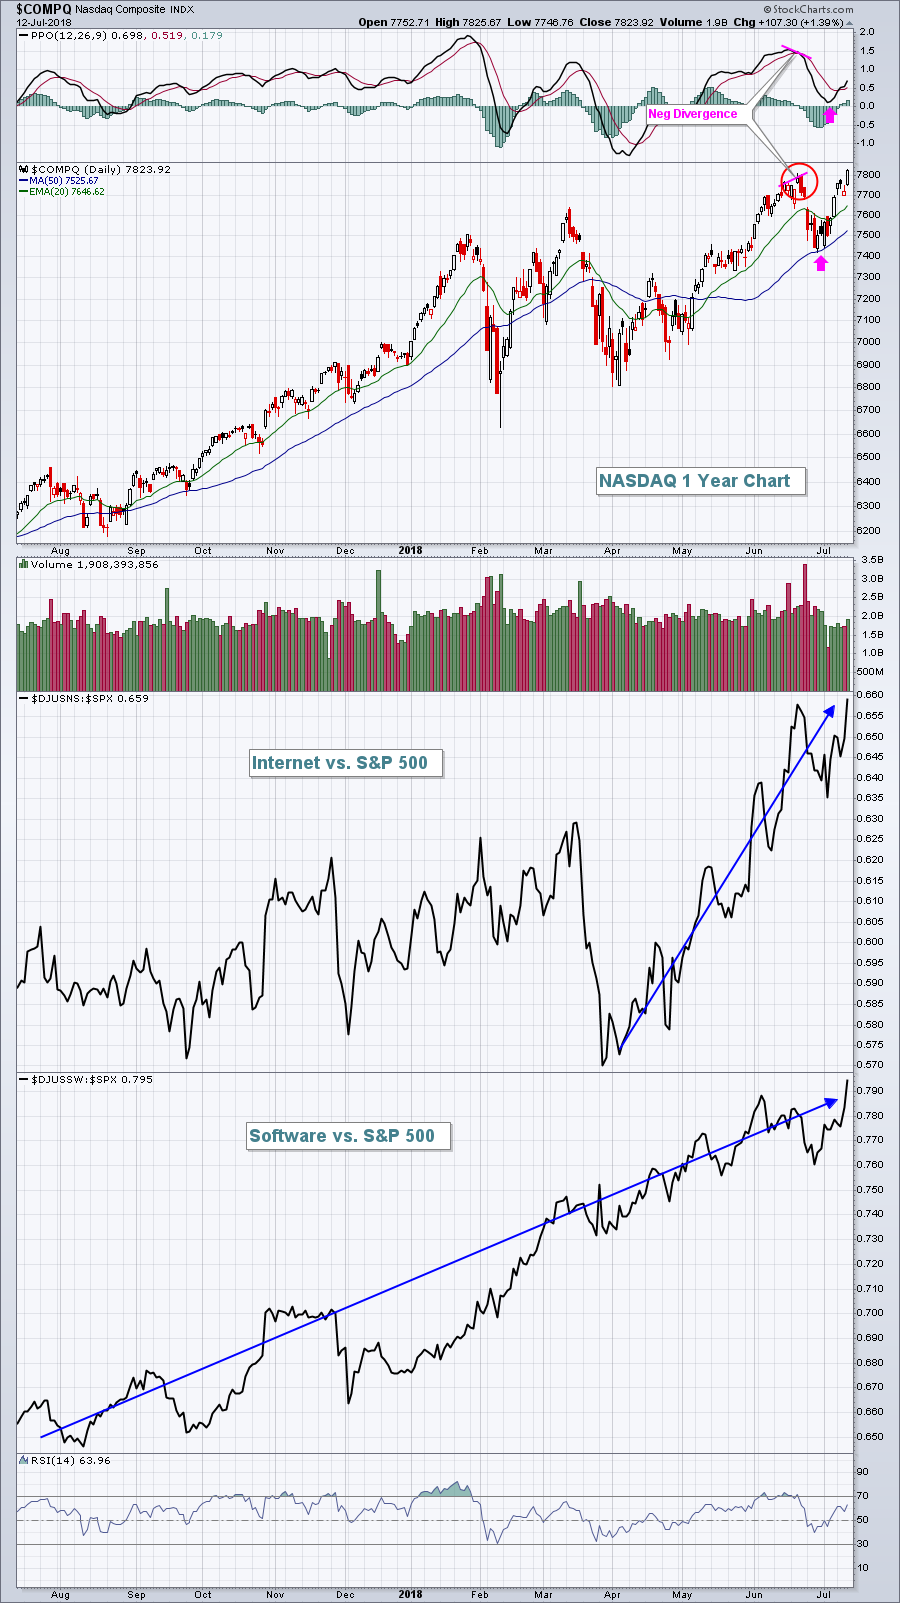 When I see a negative divergence followed by a reversing candle, I immediately think (and expect) we'll get a 50 period SMA test and reset the PPO at centerline support. That's what happened with the NASDAQ as the pink arrows highlight. Once the slowing momentum issue was resolved, however, the NASDAQ has soared, carried by relative strength in both internet and software stocks. Beautiful indeed.
Industrials (XLI, +1.17%) were also strong on Thursday, led by defense ($DJUSDN, +2.07%) and aerospace ($DJUSAS, +1.59%). Biotechnology ($DJUSBT, +1.48%) continued its recent hot streak, pacing healthcare (XLV, +1.11%). At the start of the month, I highlighted biotechs as a group that loves the month of July. The DJUSBT is up roughly 7% in the first 12 days of the month as history once again repeats itself.
Pre-Market Action
The 10 year treasury yield ($TNX) is down 2 basis points to 2.83% this morning and stubbornly refuses to reclaim its declining 20 day EMA, currently at 2.87%. It'll be interesting to see how U.S. stocks react to that, along with mixed results from large banks reporting quarterly results this morning. JP MorganChase (JPM) posted solid results, as did PNC Financial Services (PNC), but both Citigroup (C) and Wells Fargo (WFC) disappointed Wall Street with uninspiring results. According to Zacks.com, all four banks reported revenue ahead of estimates (although Reuters is reporting that Citigroup fell slightly short). But WFC clearly missed on its bottom line. Let's watch to see how traders react during today's session before drawing any short-term conclusions. I would watch the 450 support level on the Dow Jones U.S. Banks Index ($DJUSBK).
The U.S. Dollar ($USD) is extending yesterday's gains and that has put pressure on commodities. Gold ($GOLD) is down $5 per ounce to $1241, testing 52 week lows near $1240 per ounce. Silver ($SILVER) has been down approximately 9% in less than a month and is now less than 1% from key support at $15.70. I have said to avoid both since the USD bottomed in 2011. I would continue to avoid both as I look for further strength in the dollar.
Asian markets were mixed overnight, with notable strength in the Tokyo Nikkei ($NIKK, +409 points, or 1.85%). We're seeing fractional gains in Europe this morning, with Dow Jones futures pointing to a slightly higher open (+11 points) with just over 30 minutes to the opening bell.
Current Outlook
The NASDAQ has been powering ahead, even before yesterday's all-time high close. It's been the index of choice the past few months, along with the small cap Russell 2000. I'm looking for that leadership to continue. To visualize how strong the NASDAQ has been and to focus on the rotation that's been taking place, let's look at the NASDAQ:Dow Jones ratio ($COMPQ:$INDU):
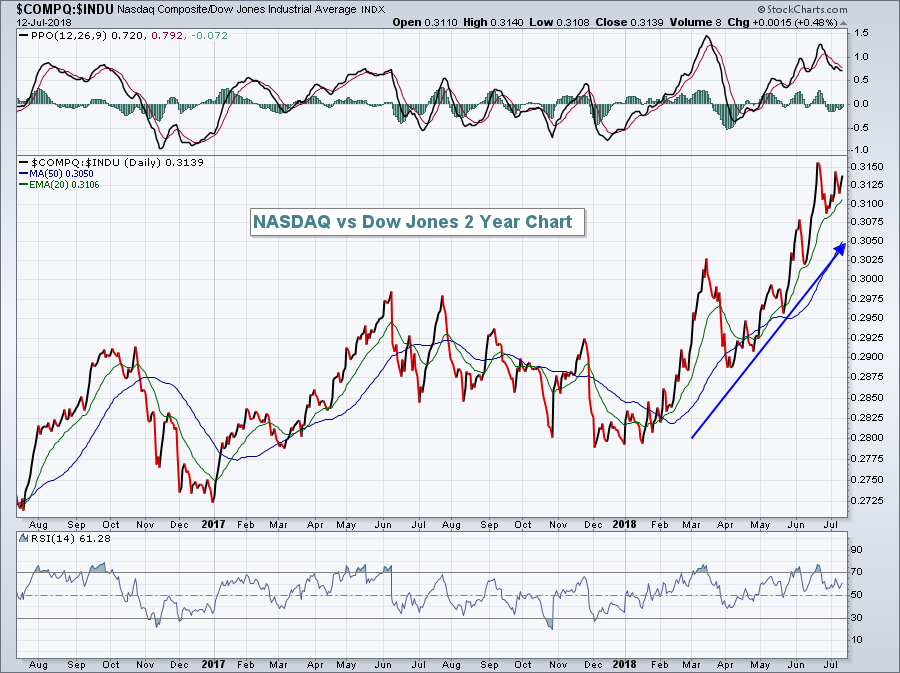 The combination of rapidly-increasing earnings and earnings estimates from high profile NASDAQ stocks and traders' trepidation in trading the multinational behemoths found on the Dow Jones during a period of a rising dollar and trade war fears has resulted in exactly what you see above - money rotating in a big, big way toward the NASDAQ. Don't fight the tape.
Sector/Industry Watch
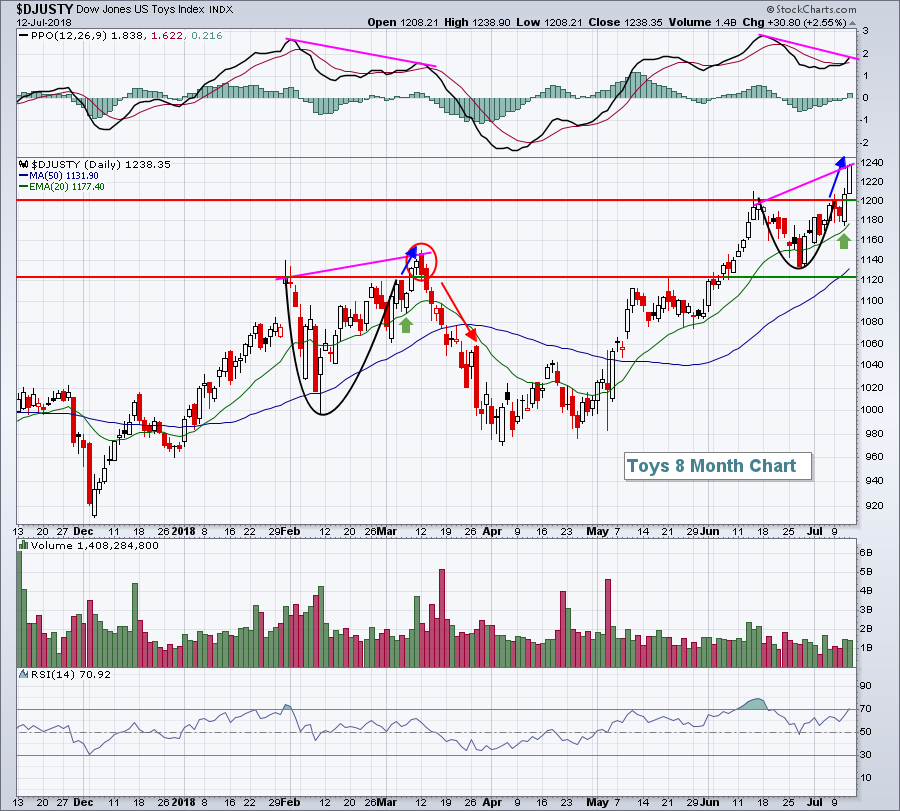
I'd categorize the Dow Jones U.S. Toys Index ($DJUSTY) as "cautiously bullish". Yes, it just broke out yesterday to an all-time high, but we saw a similar breakout in March that failed with a negative divergence in play. The DJUSTY is sporting a negative divergence now that brings back some unfavorable memories. Let's look at the chart:
 A negative divergence occurs any time prices move to a new high and the PPO does not follow suit. That's the definition of a negative divergence. Of course, I have my own interpretations. When you're deep into an uptrend, a breakout frequently occurs with a negative divergence, but that is not always a sign of slowing momentum. You need to evaluate volume on the breakout as the PPO does not consider volume. If massive volume accompanies a breakout, that is a signal of major accumulation, not a signal of slowing momentum. In that case, I ignore the negative divergence, at least so long as the breakout holds. Also, when a breakout is first made, we don't know how long the uptrend will last. Many times there's a negative divergence on the breakout, but it is eliminated as price action continues higher and momentum builds.
Volume on the latest breakout on the DJUSTY is suspect for sure. But we don't know at this point how far the rally will carry. The PPO has turned higher and, if the DJUSTY rallies for a few more days, we could see the negative divergence eliminated. I'd watch for one of two things to grow more bearish - either (1) failure to hold the breakout near the 1200 level or (2) a reversing candle on increasing volume. If either of those two occur, I'd lock in profits. Otherwise, I'd let it ride.
Historical Tendencies
The NASDAQ moves from a bullish historical period to a bearish historical period much like a water faucet moves from hot water to cold. Here are the NASDAQ's annualized returns for these two periods since 1971:
July 11th through July 17th: +61.63%
July 18th through July 24th: -41.76%
Key Earnings Reports
(actual vs. estimate):
C: 1.62 vs 1.54
INFY: .27 vs .25
JPM: 2.29 vs 2.22
PNC: 2.72 vs 2.58
WFC: 1.08 vs 1.12
Key Economic Reports
July consumer sentiment to be released at 10:00am EST: 98.4 (estimate)
Happy trading!
Tom
