Market Recap for Monday, August 20, 2018
Leadership from technology (XLK, -0.15%) was lacking, but strength in consumer discretionary (XLY, +0.71%), materials (XLB, +0.70%), energy (XLE, +0.67%) and industrials (XLI, +0.67%) was more than enough to offset areas of weakness as all of our major indices posted gains. If the Dow Jones and S&P 500 are to make breaks above their January highs, we'll need to see more large cap strength in the sector ETFs. Healthcare (XLV, +0.33%) already made that breakout, as can be seen below:
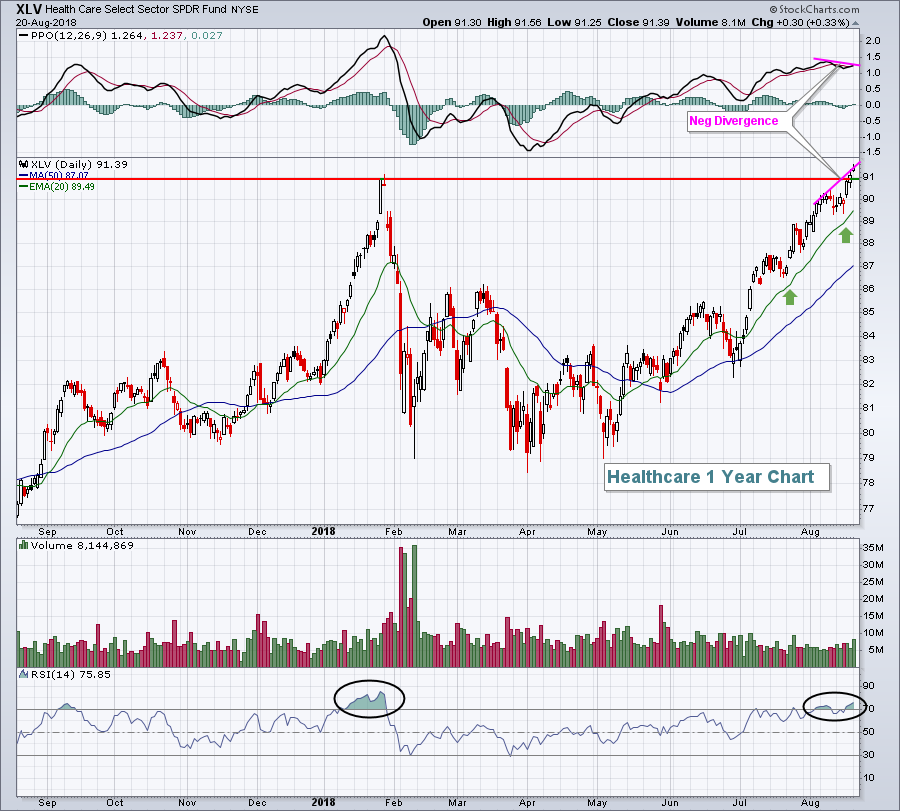 There is a slight negative divergence in play here, but the PPO has begun to turn higher again so let's see how far this rally goes and whether the negative divergence can be eliminated. Yesterday's volume was increasing, which is not a sign of slowing momentum.
In the meantime, consumer discretionary is regaining its relative strength and one of the primary reasons is that retailers (XRT+1.43%) have broken to a fresh all-time high. Check this out:
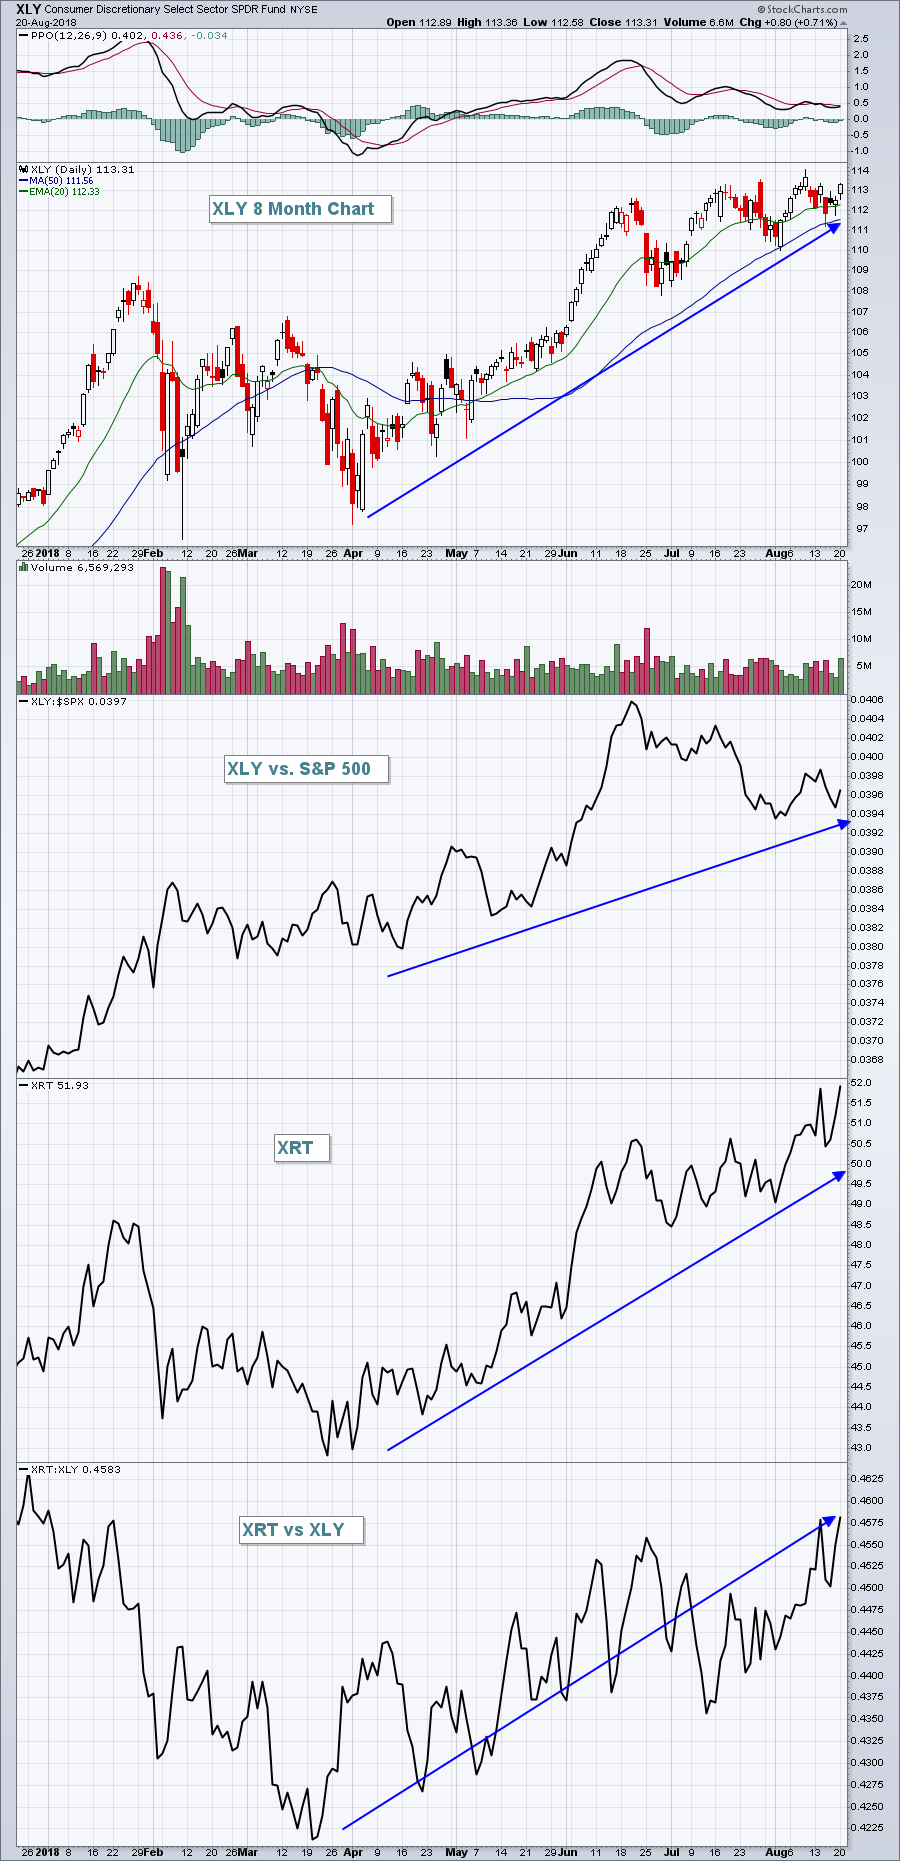 While the XLY isn't at an all-time high close, you can see that it's well above the January high and that's resulted in clear outperformance vs. the S&P 500. That relative strength is turning higher once again and retail stocks are aiding this advance. The XRT:XLY ratio at the bottom of the above chart has been rising solidly since March and that's been a major component behind consumer discretionary's market leadership.
Pre-Market Action
The 10 year treasury yield ($TNX) has been declining since its early August high, but is higher by two basis points to 2.84% this morning. August and September have historically been poor months for equities so defensive areas like treasuries have a history of strong performance (which sends yields lower). Gold ($GOLD) is bouncing off very oversold conditions, up another $4 this morning. Despite the recent bounce, GOLD currently trades just beneath $1200 per ounce.
Asian markets performed well overnight, while European markets are mixed this morning. U.S. equities look to start the day with gains as Dow Jones futures are higher by 50 points with just over an hour to the opening bell.
Current Outlook
The S&P 500 has been trending higher since early April, but we are nearing a major overhead price resistance level that could potentially mark "Point C" in an ascending triangle pattern. Whether or not that pattern eventually unfolds, the key here is that a major price resistance level is close and we should respect it:
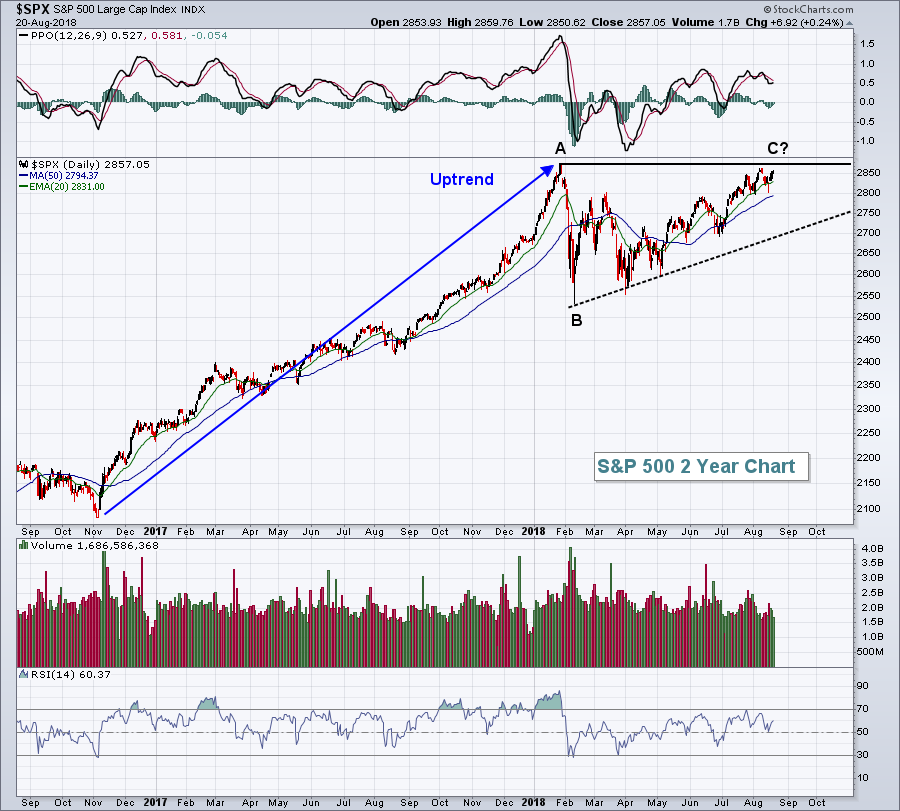 We saw a surge in U.S. equity prices off the November 2016 low that culminated with an all-time high close of 2873 on January 26th (Point A). Since that time, we've seen a significant reaction low in February (Point B) that was retested in early April. Over the past five months, we've seen a steady uptrend with yesterday's close of 2857 nearly eclipsing the closing high of 2858 earlier this month. 2873 isn't far off.
After a serious uptrend like the one we saw from November 2016 through January 2018, I evaluate the technical deterioration during retracements and, quite honestly, I saw nothing more than a correction in February. I didn't think it was the start of a bear market then and I certainly don't now. Instead, I wrote ("I'll Step Out On That Limb, The Bottom Is In") about the likelihood that some type of bullish continuation pattern would develop as the selling escalated. While I missed the bottom by a mere two days, here we are, 6-7 months later, and we're still consolidating and trying to clear that 2873 closing high. I'm not saying we won't break above that threshold in the near-term, but it will be a challenge, especially with the U.S. Dollar ($USD) rising and breaking out recently. A stronger dollar negatively impacts the overseas earnings of multinational companies found on the S&P 500. If the USD continues to strengthen, don't be surprised to see a number of S&P 500 companies warn due to the high-flying greenback. That could be a significant headwind in September, which also just happens to be the worst calendar month of the year for the S&P 500 since 1950.
Sector/Industry Watch
Computer hardware ($DJUSCR) has been lifted recently by Apple, Inc. (AAPL), the first $1 trillion market cap company in history. But another company in this space has actually been a much better performer than AAPL and it's currently trading in a bullish continuation pattern. Who is it?
Network Appliance (NTAP):
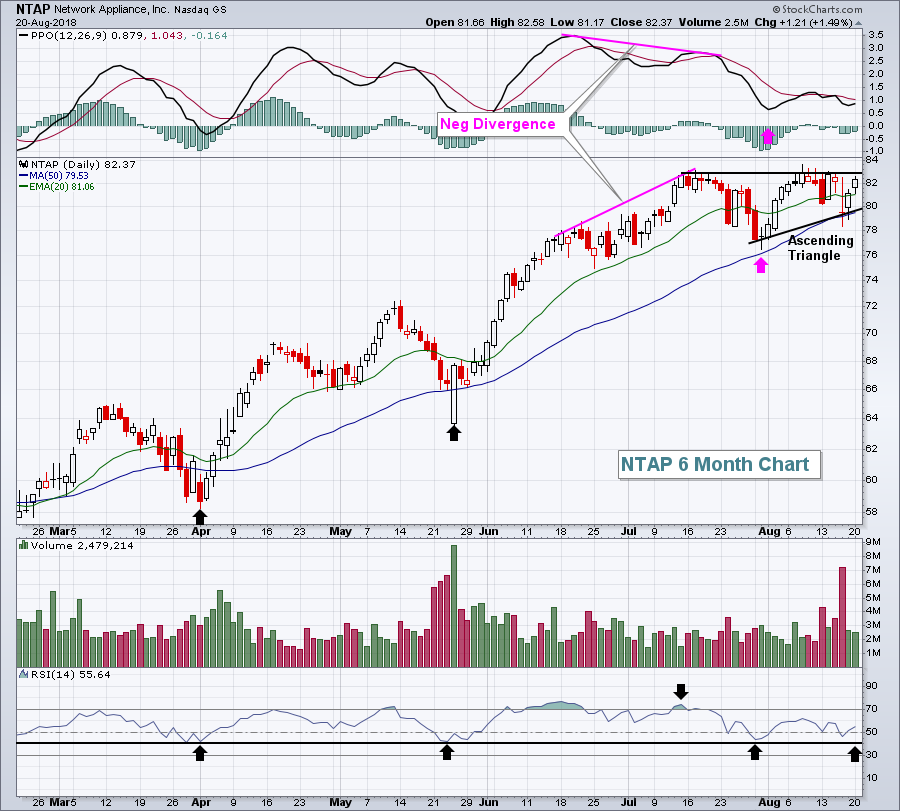 NTAP is up 50% since the start of the year, but there were hints of slowing price momentum with the negative divergence that printed at the July price high. NTAP also had uninspiring volume on that breakout and was overbought with an RSI above 70. It simply needed a break and we've seen that break in the form of a bullish ascending triangle pattern. After a negative divergence, I look for 50 day and PPO centerline tests to "reset" momentum back to zero and then look for either a breakdown or resumption of the uptrend. The ascending triangle allowed NTAP to consolidate as we nearly saw both 50 day and PPO centerline tests (pink arrows). Also, note the black arrows have mostly highlighted oversold conditions within an uptrend. RSI 40-50 typically provides solid support during uptrends and that's what I've highlighted above.
Look for either a high volume breakout above 83 to confirm the next leg higher or a lower volume pullback closer to triangle support, perhaps 79-80, which also could coincide with another RSI dip into the 40s. I'd be a buyer of NTAP in either scenario.
Historical Tendencies
Yesterday's gains were a tad bit surprising given the historical nature of Monday performance, especially Mondays that fall after monthly options expire. (Monthly options expire the 3rd Friday of every month.)
Mondays are the worst performing day of the week on the S&P 500 since 1950.......and it's not even close. And Mondays that fall from the 17th day of the calendar month through the 31st all have one thing in common. They have negative annualized returns. The 19th through 25th are particularly bad for Mondays. Mondays that fall within this week of the calendar month have gained ground only 41% of the time. This compares rather unfavorably to the 53% chance of the S&P 500 rising on any given day since 1950. In addition, the annualized return on Mondays that fall in that 19th to 25th time frame is -44.22% over the past seven decades.
Yesterday was Monday, August 20th. I do use historical tendencies in my trading, but I always emphasize that these tendencies take a back seat to technical analysis. They are an aid, but not my primary decision-making tool.
Key Earnings Reports
(actual vs. estimate):
KSS: 1.76 vs 1.65
MDT: 1.17 vs 1.11
SJM: 1.78 vs 1.81
TJX: 1.05 (estimate - awaiting results)
TOL: 1.26 vs 1.03
(reports after close, estimate provided):
JKHY: .95
KEYS: .80
PSTG: (.05)
URBN: .76
Key Economic Reports
None
