Market Recap for Tuesday, September 18, 2018
It was a solid day on Wall Street. One day after seeing weakness in key areas like technology, consumer discretionary and tranportation stocks and the increasing historical likelihood of further downside action, stocks rebounded....in a big way. Leading the charge were our aggressive sectors - consumer discretionary (XLY, +1.27%), industrials (XLI, +0.91%), and technology (XLK, +0.64%). Energy (XLE, +0.66%) also had a strong session, but failed at short-term price resistance:
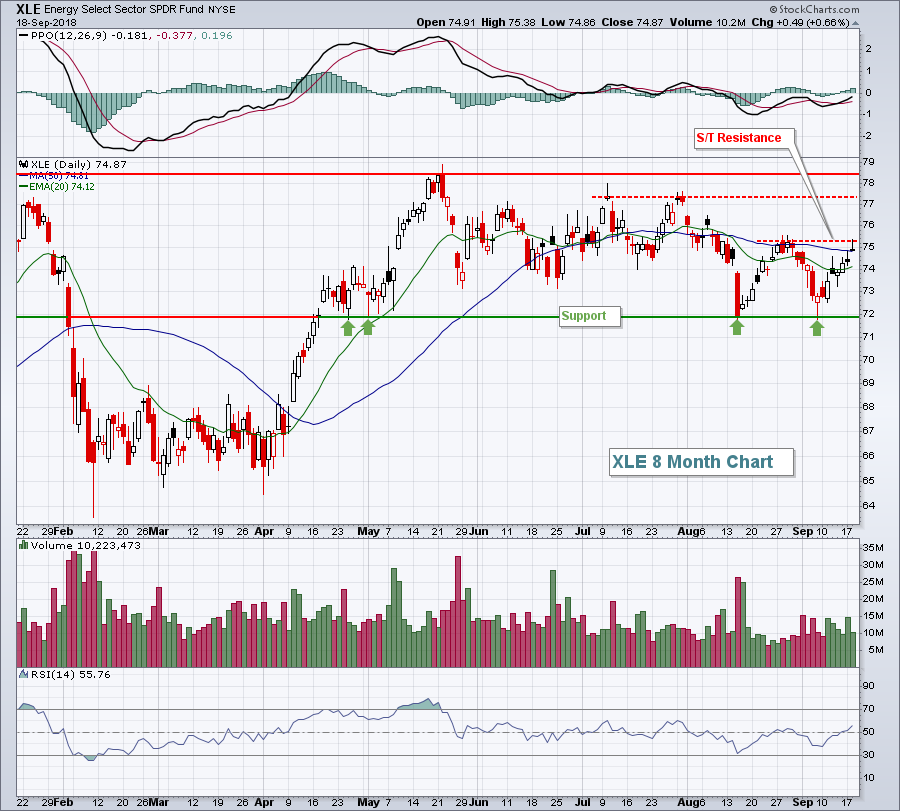 The bounce off 72 price support was timely, but the short-term price resistance just above 75 held for now. So the XLE is in a short-term trading range of roughly 72.00-75.25.
Specialty retailers ($DJUSRS, +2.25%) were one of the biggest consumer discretionary losers on Monday, closing just beneath their 20 day EMA. Yesterday, however, the group surged back to the top of the leaderboard and easily topped that moving average, leading the XLY and regaining their technical health in the process:
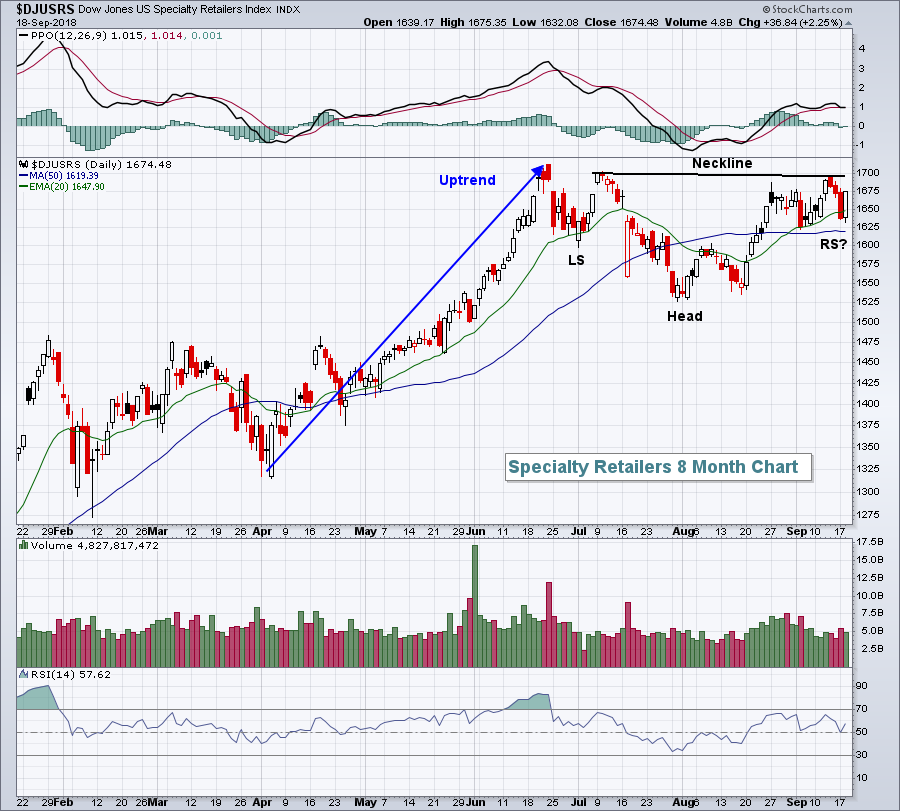 There appears to be a bullish continuation pattern in play here - an inverse head & shoulders pattern. A heavy volume breakout above 1700 should lead to added strength in this space, but I'm not sure the inverse right shoulder is complete so I'm a bit hesitant to jump right in on the long side. The inverse left shoulder touched 1600. We can't rule out a similar inverse right shoulder touch.
Pre-Market Action
It's a very interest pre-market session today. Asian markets were higher, mostly above 1% and we're seeing more moderate strength in Europe. But U.S. futures are lower, which is strange. Housing starts and building permits were mixed this morning and there's very little earnings news.
Still, it appears we'll likely get off to a slightly lower start with Dow Jones futures currently lower by 21 points with less than an hour to the opening bell.
Current Outlook
One of the more bullish developing stories for equities is actually taking place outside the equity markets. Yesterday, the 10 year treasury yield ($TNX) closed at 3.05%, a definitive breakout of its boring 2.81%-3.01% range that it had been mired in for the past 3-4 months. That means that money is rotating in significant fashion OUT of the more defensive treasury market. Always remember that there's a perfect 100% inverse relationship between treasury prices and treasury yields. When treasuries sell off, yield rise. It's that simple. And when treasuries are sold, what happens to the proceeds? Well, treasuries generally sell off as economic conditions strengthen. Strengthening economic conditions are typically a boost to Corporate America's bottom line which, in turn, leads to higher S&P 500 prices. That's why there's a positive correlation between the direction of the TNX and the direction of the S&P 500. The TNX still must negotiate the high it established in May 2018 at 3.11%. A breakout there could lead to a rush of buying in U.S. equities. I believe it will happen. Here's the intermediate-term view of the TNX:
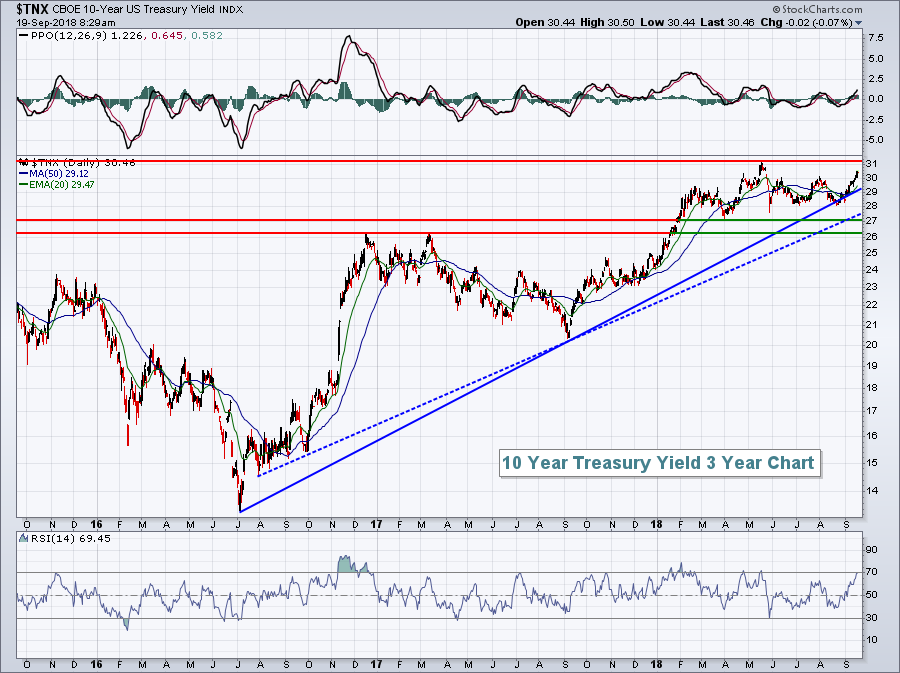 The intermediate-term trading range for the TNX is the double top breakout of 2.62% as yield support and the May 2018 high of 3.11% as yield resistance. I've drawn a couple trendlines on this chart, but trendlines are dangerous because you can rather subjectively draw the lines to connect whatever you want. The solid blue line above connects key lows since the July 2016 low. The problem here is the few number of intersecting points. Trendlines are only as strong as the number of price points they connect. While it's difficult to say which yield point is most important on this chart from a trendline perspective, I can say that TNX support near 2.62% is very critical to this intermediate-term chart.
A breakout above 3.11% is exactly what the bulls want to see. Don't listen to the "higher interest rates are bad for the economy" hype.
Sector/Industry Watch
The Dow Jones U.S. Footwear Index ($DJUSFT, +2.20%) trailed only specialty retailers among consumer discretionary industry groups on Tuesday. Better yet, the DJUSFT broke out of a bullish cup with handle continuation pattern that suggests we'll see more upside:
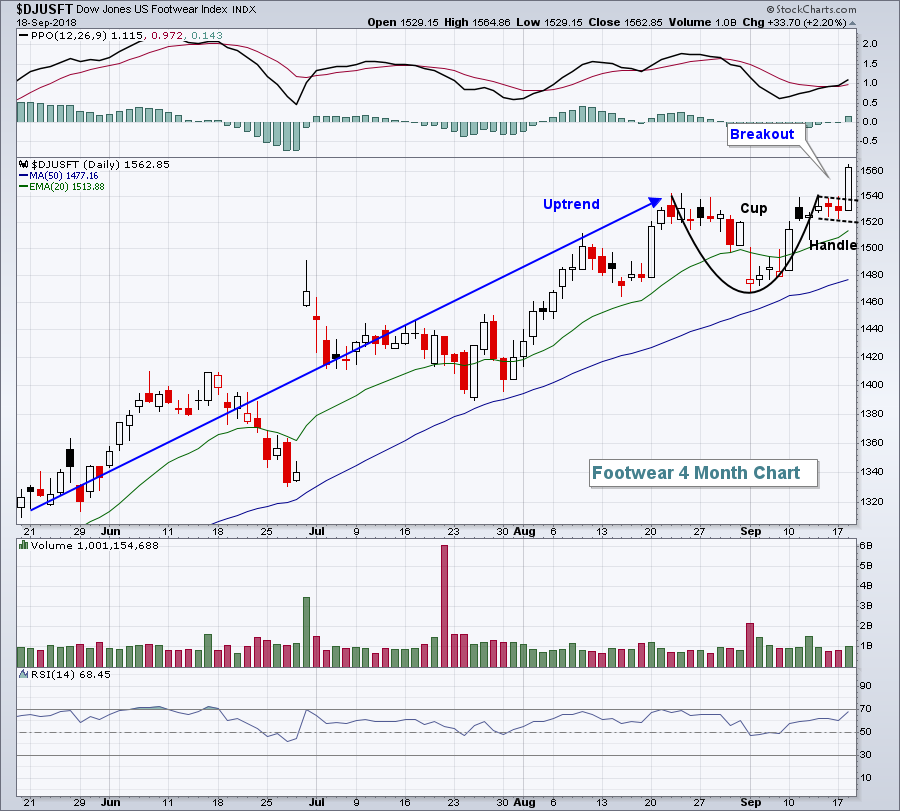 Footwear stocks have been among the best consumer discretionary performers in 2018 and the technical outlook remains quite strong.
Historical Tendencies
The 19th calendar day of the month is generally not a good day. Of course, there have been many exceptions over the years, but the tendency is to see lower prices on the 19th. Many of us remember October 19th, 1987 (Black Monday), when the S&P 500 fell 20.47% in a single day! But even if we exclude that day - one of the worst stock market days in our history - the 19th remains the worst performing calendar day. One of the reasons for this weakness, in my opinion, is that it is close to the 3rd Friday of the month when monthly options expire. Many times, there are short-term advantages for market makers to work their magic (sarcasm intended) and take prices lower to squeeze out option premium. With September options expiring this Friday, will we see the 19th do its magic once again?
Here are the annualized returns on our major indices for the 19th calendar day of the month (all months):
S&P 500: -33.44% (since 1950)
NASDAQ: -28.48% (since 1971)
Russell 2000: -32.34% (since 1987)
On the S&P 500, the next closest calendar day is the 9th with an annualized return of -17.19%.
Key Earnings Reports
(actual vs. estimate):
CPRT: .47 (estimate, awaiting results)
(reports after close, estimate provided):
RHT: .81
Key Economic Reports
August housing starts to be released at 8:30am EST: 1,282,000 (actual) vs. 1,240,000 (estimate)
August building permits released at 8:30am EST: 1,229,000 (actual) vs. 1,315,000 (estimate)
Happy trading!
Tom
