Market Recap for Wednesday, September 12, 2018
It was a day of bifurcation as it's difficult to sustain a rally when your two worst sectors are financials (XLF, -0.92%) and technology (XLK, -0.42%). As you might expect, relative weakness was found on the NASDAQ and Russell 2000 as technology shares weighed, particularly those in internet ($DJUSNS, -1.63%) and semiconductors ($DJUSSC, -1.20%) areas. The good news, however, is that the DJUSSC rallied off what could have been a significant breakdown, holding onto price support instead:
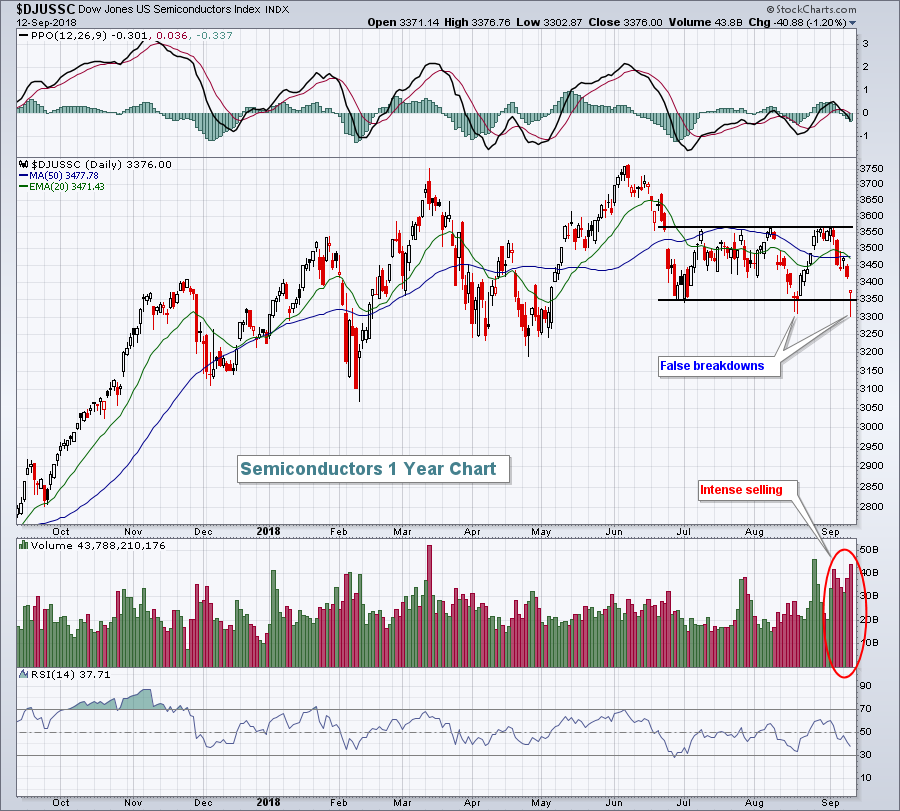 The overall uptrend in semis remains intact, but a short-term breakdown was on the horizon yesterday. Fortunately for the bulls, buying kicked in during the afternoon session and the DJUSSC finished on its high of the day, despite the 1.20% loss.
Financials were led lower by a myriad of industries, but banks ($DJUSBK, -1.38%) took a big toll, closing at their lowest level in 6-7 weeks:
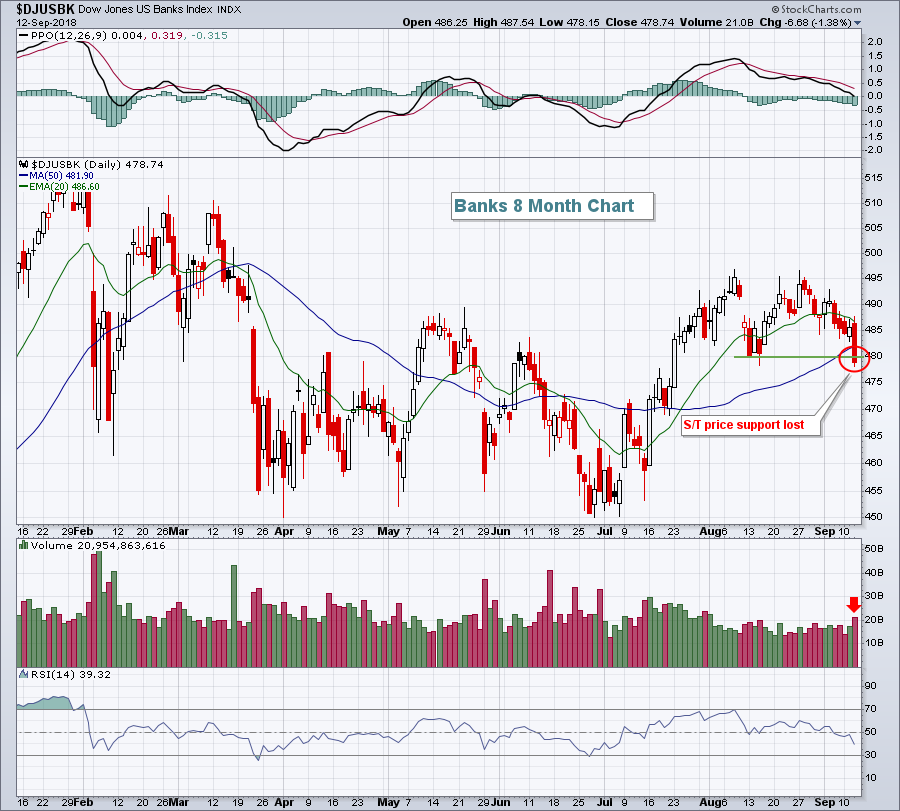 Volume accelerated on Wednesday to accompany the group's lowest close since July - obviously not a great development. I really would like to see the banks turn things around today, or very quickly. The PPO is just now testing centerline support and the price breakdown wasn't by a wide margin. An up day today and all might be forgiven.
Consumer staples (XLP, +1.16%) was the clear sector winner on Wednesday as tobacco ($DJUSTB, +4.95%) and drug retailers ($DJUSRD, +2.02%) found plenty of buyers.
Pre-Market Action
Economic reports continue to show moderate economic growth with little inflation, a solid combination for equities. Initial jobless claims came in below expectations again this morning, while inflation at the consumer level suggested little to worry about....one day after negative inflation readings at the producer level.
One day after climbing above $70 per barrel, crude oil prices ($WTIC) have dipped back below, falling 1.2% at last check to $69.52 per barrel. Gold ($GOLD) is flat after moving back above its 20 day EMA on Wednesday. Closing above $1220 an ounce is the short-term goal if you're bullish gold. That's the recent price high and the 50 day SMA. Gold hasn't closed above its 50 day SMA since April.
If the U.S. takes its cue from global markets, it should be in good shape today. Overnight, Asian markets were quite strong and Europe is strong as well this morning, but to a lesser extent. Dow Jones futures are higher by 102 points with roughly 30 minutes to the opening bell.
Current Outlook
I try to evaluate the big picture using weekly charts which, in my opinion, remain very bullish. Within that larger picture, however, we see uptrends followed by short-term periods of profit taking, only to then see higher highs established. This price behavior becomes clearer looking at a short-term 60 minute chart:
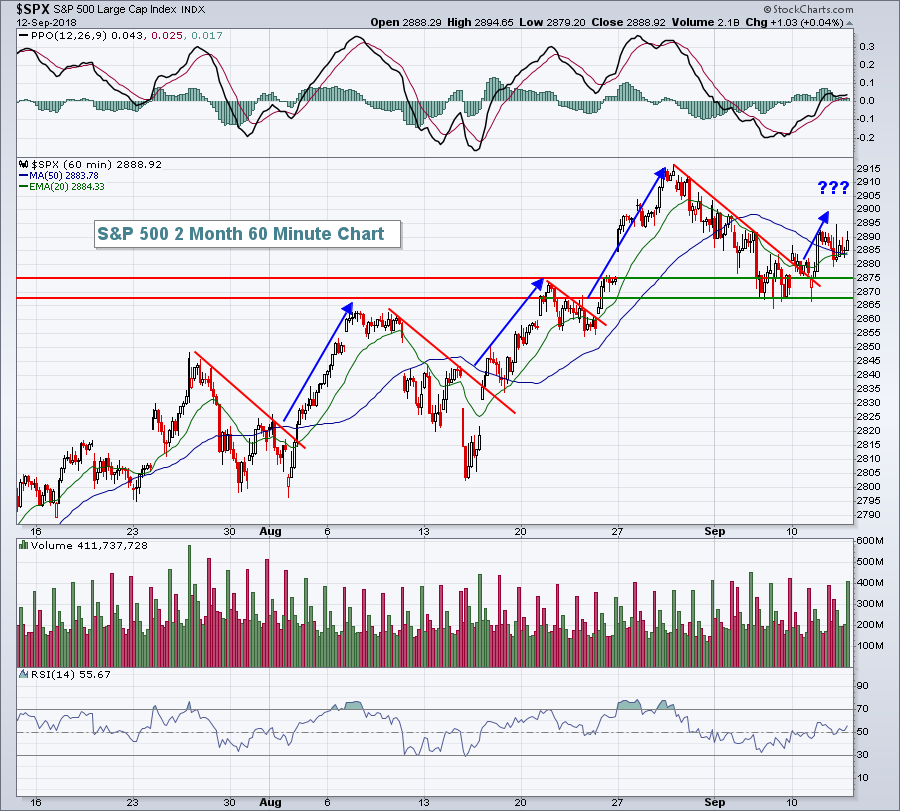 We've recently broken to all-time highs on the S&P 500 and the "stair-stepping" push to the upside can easily be seen above. After breaking a 1-2 week downtrend, the S&P 500 now appears to be trending higher once again.....but how high? The all-time high was 2916 on August 29th. That would be the key price resistance level.
Sector/Industry Watch
Consumer staples (XLP) rallied yesterday and is on the verge of clearing its reaction high resistance from February. While I always talk about relative strength and how important it is to see aggressive sectors leading, we still need all sectors to perform well. Wide participation is a hallmark of raging bull markets. Certain sectors will outperform and lead, but we want lots of new money fueling the rise in equities and even defensive groups should see enough of that money to move higher. Here's the current technical view of the XLP:
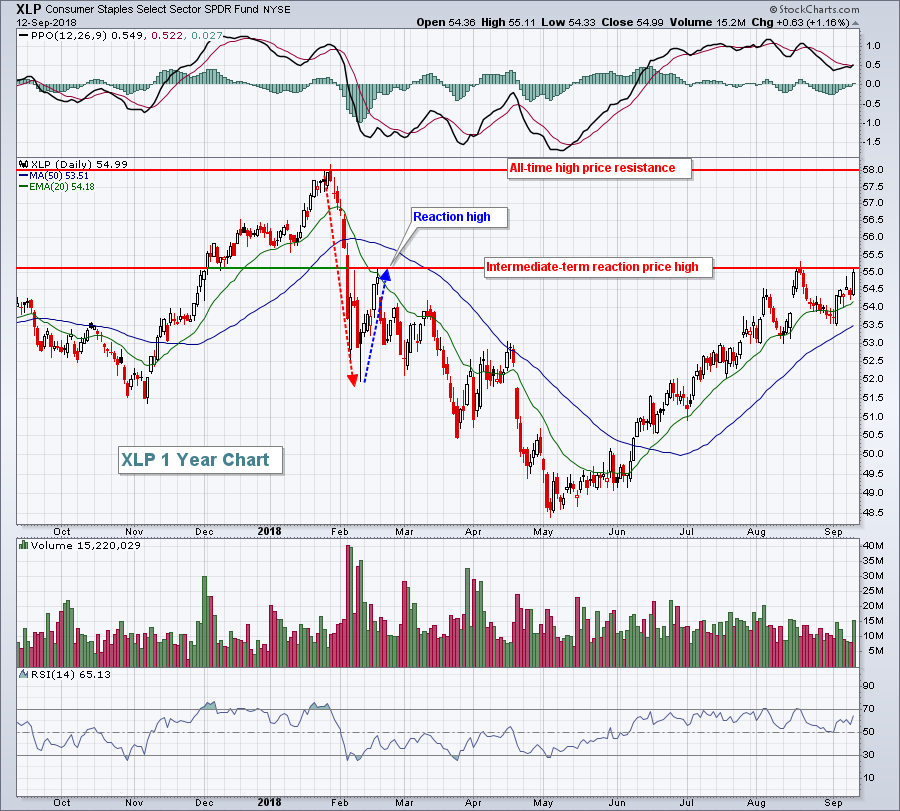 A reaction high is nothing more than the initial attempt to rally after a selloff. The February reaction high is illustrated above with the blue dotted directional line. It's been months since the XLP closed definitively above 55.10. A close above that level would likely result in the January 2018 all-time high of 58.00 being revisited.
Historical Tendencies
The Wednesday through Friday period has been the most bullish period of the calendar week since 1950 on the S&P 500. These three days have risen 55.5% of the time (vs. 50.1% on Mondays and Tuesdays) and have produced annualized returns of approximately 16% over the past seven decades, well above the average annual return of 9%.
Key Earnings Reports
(actual vs. estimate):
KR: .41 vs .38
(reports after close, estimate provided):
ADBE: 1.69
Key Economic Reports
August CPI released at 8:30am EST: +0.2% (actual) vs. +0.3% (estimate)
August Core CPI released at 8:30am EST: +0.1% (actual) vs. +0.2% (estimate)
Initial jobless claims released at 8:30am EST: 204,000 (actual) vs. 210,000 (estimate)
Happy trading!
Tom
