Market Recap for Monday, November 12, 2018
Welcome back bears. Welcome back volatility. It was another day of steep losses on Wall Street, underscoring the likely end to what the bulls were hoping was a sustainable rally back to recent highs. There was a major test last week for the bears as the Volatility Index ($VIX) had crept to within 16 (intraday low was 16.09). For those keeping score, the VIX never dropped below 16 during each of the past two bear markets. A certain level of fear is required to keep bear markets (or the potential for bear markets) alive. The bears were up to the challenge as we've seen a significant bounce off of that 16-17 bear market support level:
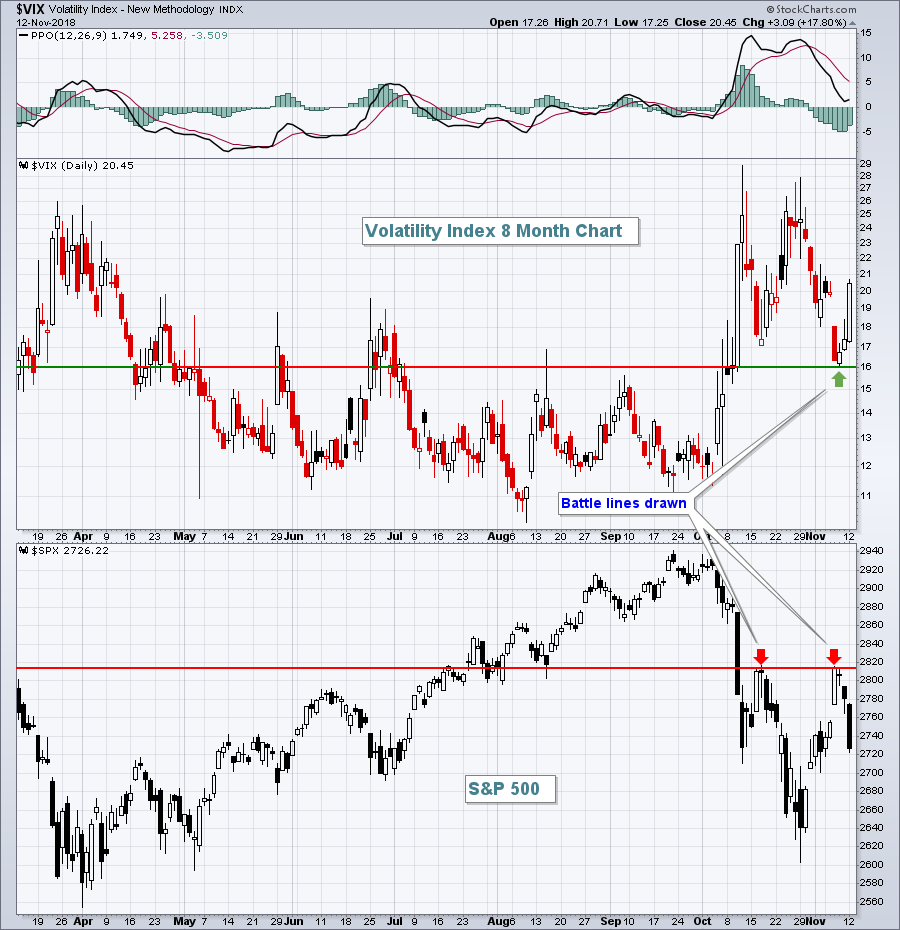 The S&P 500's double top just below 2820 will now serve as very significant price resistance.
There was a return to defensive sector rotation yesterday as real estate (XLRE, +0.20%) was the only sector to finish in positive territory. Utilities (XLU, -0.05%) and consumer staples (XLP, -0.53%) lost ground, but were clear outperformers on a relative basis. Weakness was found throughout most areas of the market, but the selling was concentrated in technology (XLK, -3.52%). Computer hardware ($DJUSCR, -4.85%) and semiconductors ($DJUSSC, -4.58%) were both hit very hard on the selling. The former struggled as Apple (AAPL, -5.04%) fell into a gap support zone created from its Q2 earnings report:
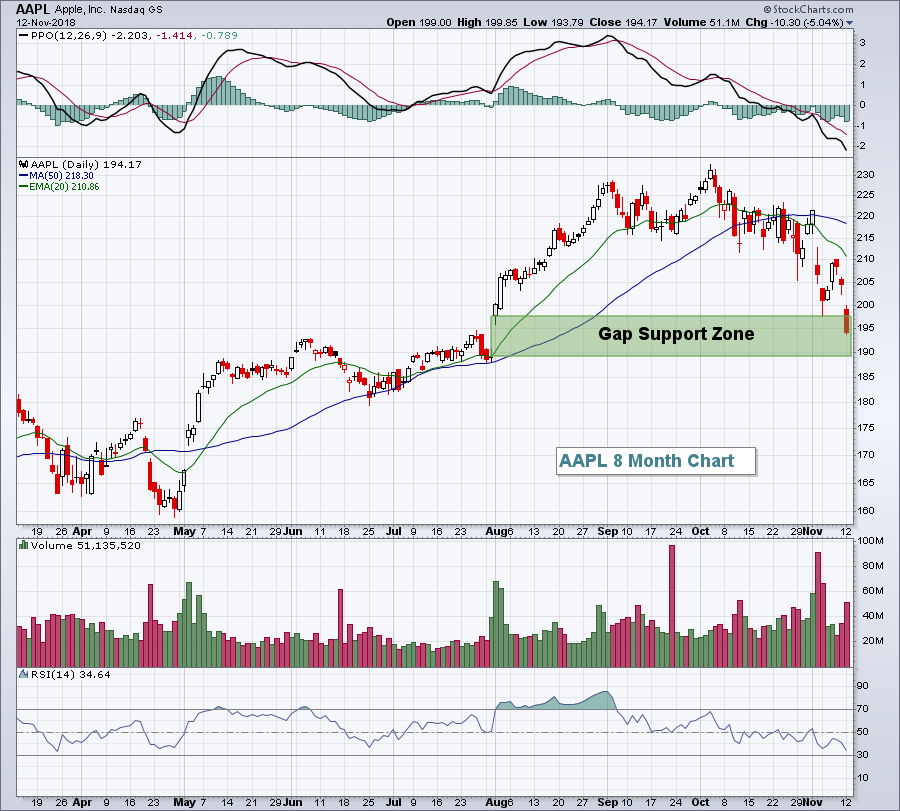 The 189-190 support area will be very important for AAPL and we could see that test today or later this week. As for semiconductors, I discuss them in further detail in the Sector/Industry Watch section below.
Pre-Market Action
Crude oil prices ($WTIC) are currently down to $59 per barrel, potentially a record 12th consecutive daily drop. This morning, the WTIC is down another 1.50%. The treasury market was closed yesterday in observance of Veterans Day in the U.S. This morning, the 10 year treasury yield ($TNX) is lower by nearly 3 basis points to 3.16% as money rotates more defensively.
U.S. stock futures are pointing to a tepid recovery at the open after a day of intense selling. Dow Jones futures are higher by 48 points with roughly 30 minutes left to the opening bell.
Current Outlook
The U.S. Dollar Index ($USD) continues to benefit from two key developments. First, the USD is viewed as a safe haven and given the elevated Volatility Index ($VIX), money is finding a home in the greenback. Second, and perhaps more importantly, U.S. interest rates continue to rise much faster than its foreign counterparts. That strengthens the dollar and the recent Fed announcement suggested this is not likely to change in the near- to intermediate-term. Check out this chart:
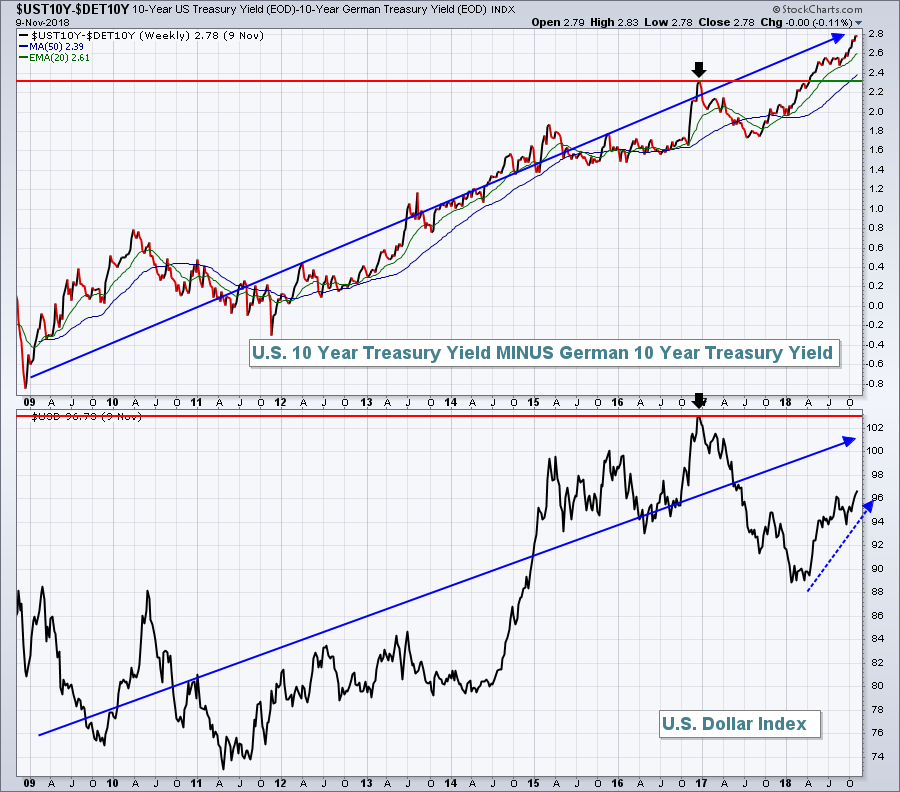 There's not a perfect positive correlation between these two, but if our economy is strengthening faster than foreign economies, we should see interest rates rising more rapidly. The top part of the chart above tells us exactly that. And if our economy is strengthening faster, and our rates are moving up faster, then it makes sense to see the USD strengthen. The black arrows above show that the Q4 2016 rally in U.S. yields and breakout was accompanied by a similar breakout in the USD. The UST10Y-DET10Y has continued to break to new highs and the USD now appears to be following suit. I'm looking for the USD to challenge, and ultimately break above, the late-2016 high near 103. That development should continue to put pressure on gold ($GOLD) and the relative performance of materials stocks (XLB). The XLB has badly lagged the benchmark S&P 500 during much of this 10 year bull market as the rising dollar has kept relative pressure on the group.
Sector/Industry Watch
Semiconductors ($DJUSSC) represent a very aggressive area within the technology sector (XLK) and many times, as semiconductors go, so goes the XLK. Well, right now it's not pretty for semiconductors. For only the second time in the last five years, we're faced with a weekly PPO that is well below centerline support and showing selling momentum that's accelerating:
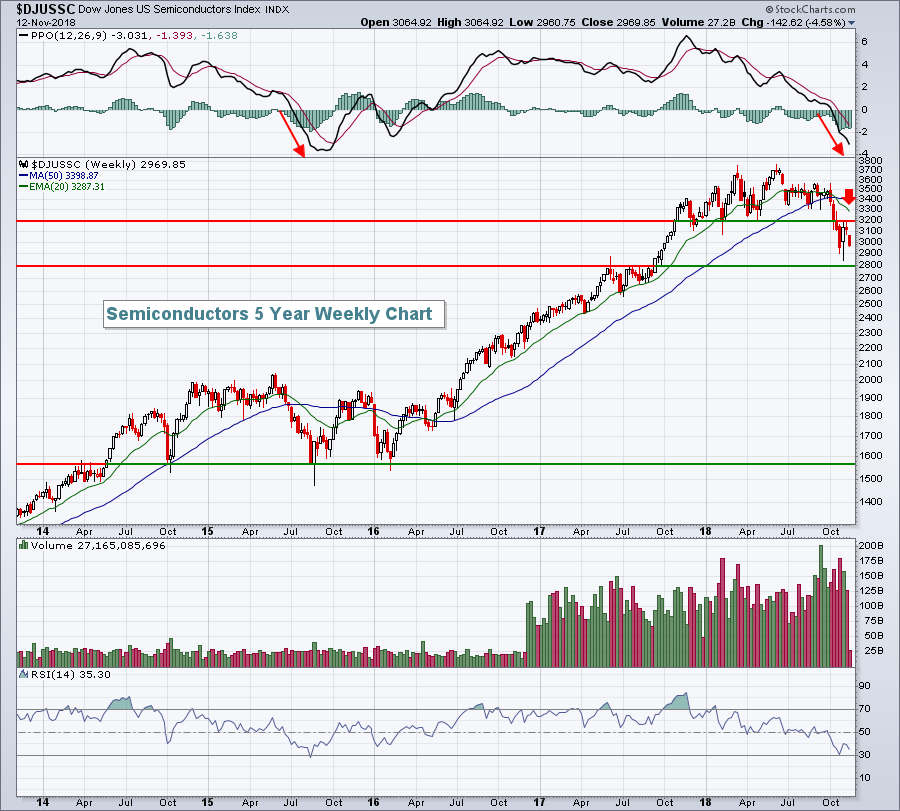 I'm a technician who believes nothing trumps price action. Based on the above, it's very difficult to be bullish this industry group. We had a significant breakout above consolidation in Q3 2017 near the 2800 level. During the October selloff, the DJUSSC nearly touched that 2800 level. Recent price highs are near 3200 and the rapidly-declining 20 week EMA (red arrow) is currently at 3287. I'd expect major resistance on any rallies in that 3200-3287 range, although the 20 week EMA will continue falling so this resistance range will be fluid and constantly dropping. 2844 was the October low, so the support range is from roughly 2800-2844. Consider this as a trading range for the balance of 2018....or until we see a breakout of this range.
Historical Tendencies
Since 1971, the NASDAQ has produced annualized returns throughout ALL calendar months as follows:
28th through 6th: +25.93%
7th through 10th: -2.33%
11th through 18th: +17.01%
19th through 27th: -4.40%
Key Earnings Reports
(actual vs. estimate):
AAP: 1.89 vs 1.77
AMX: .30 vs .33
ARMK: .70 vs .71
HD: 2.51 vs 2.27
TSN: 1.58 vs 1.33
(reports after close, estimate provided):
TLRY: (.14)
Key Economic Reports
None
Happy trading!
Tom
