Market Recap for Wednesday, October 31, 2018
Let's start with the positives from Wednesday's action. First, all of our major indices rebounded and finished higher on the session, led by the more aggressive NASDAQ and NASDAQ 100. These two indices had been crushed both on an absolute and relative basis (vs. the benchmark S&P 500). So seeing strength return to this tech-laden area of the market was encouraging. Second, four of the five top sectors were aggressive sectors - technology (XLK, +2.38%), communication services (XLC, +2.06%), financials (XLF, +1.39%) and consumer discretionary (XLY, +1.29%). The three losing sectors were all defensive - real estate (XLRE, -1.35%), utilities (XLU, -1.18%) and consumer staples (XLP, -0.94%). When we see rallies, this is exactly the type of composition to look for. But one day doesn't turn things around. We'll need to see much more of this market behavior over the coming days and weeks.
Software ($DJUSSW, +2.77%) was a key leader on Wednesday. The group had been slammed throughout much of October and was certainly due for a reprieve. The good news is that software stocks rallied and led the advance. The bad news is that an attempt to clear 20 day EMA resistance failed. Check out the Sector/Industry Watch section below for more details.
Another group that was very strong was internet ($DJUSNS, +3.83%). Beaten-down names like Netflix (NFLX, +5.59%), Facebook (FB, +3.81%) and Twitter (TWTR, +2.63%) all rallied. Again, that was the good news. The bad news was that they all finished well off their intraday highs, setting up a possible reversal to the downside that we'll need to monitor closely. The big news in this space was FB's quarterly earnings report. FB easily surpassed Wall Street consensus estimates as to EPS, but came up short on revenues for the second consecutive quarter. FB gapped above its 20 day EMA and had an opportunity for a really big day technically. Unfortunately, there were sellers ready at the open and FB failed to close above its 20 day EMA. We'll see if FB gets any follow-through buying today.
Pre-Market Action
Gold ($GOLD) is having a strong morning as the U.S. Dollar Index ($USD) cools off. Crude oil ($WTIC), however, continues to retreat this morning and is now back at $65 per barrel. Asian markets were mixed overnight, while European markets mostly hover near their flat line.
Dow Jones futures are higher by 78 points with less than 30 minutes to the opening bell as the U.S. stock market looks to rebound for a third consecutive day.
Current Outlook
Yesterday, I wrote about key resistance levels to watch for on the S&P 500 from 2720 to 2760. I'm still having some technical glitches posting charts, which I'm working on. In the meantime, however, if you pull up a 6 month daily chart of the S&P 500 ($SPX), and you use candlesticks, you'll see that yesterday's action saw the SPX hit 2736.69. That was into the resistance zone of 2720-2760 that I wrote about. There was also a shooting star candle (looks like an upside down hammer) that printed. That candle many times signals a top, especially if it coincides with a key resistance level. In the case of the S&P 500, the October 11th close of 2728.37 represented a key short-term price support as the SPX bounced from there over the next few days. Once we lost that level of support, that became short-term price resistance. It's TA 101 - broken price support becomes price resistance. Therefore, yesterday's candle on the SPX showing an intraday high of 2736, but a close of 2711 may have marked a near-term top. Technicians will be watching to see if yesterday's high of 2736 can be negotiated. If so, more critical resistance is just above the 2750 level.
Sector/Industry Watch
Any time we see a selloff like we did recently with volatility surging, the first key technical test on the daily chart arises at the declining 20 day EMA. Many times we'll see failures at that level and that's what I'm currently watching. As an example, let's take a look at the software group ($DJUSSW), which was a stock market leader for quite awhile but completely fell apart in October:
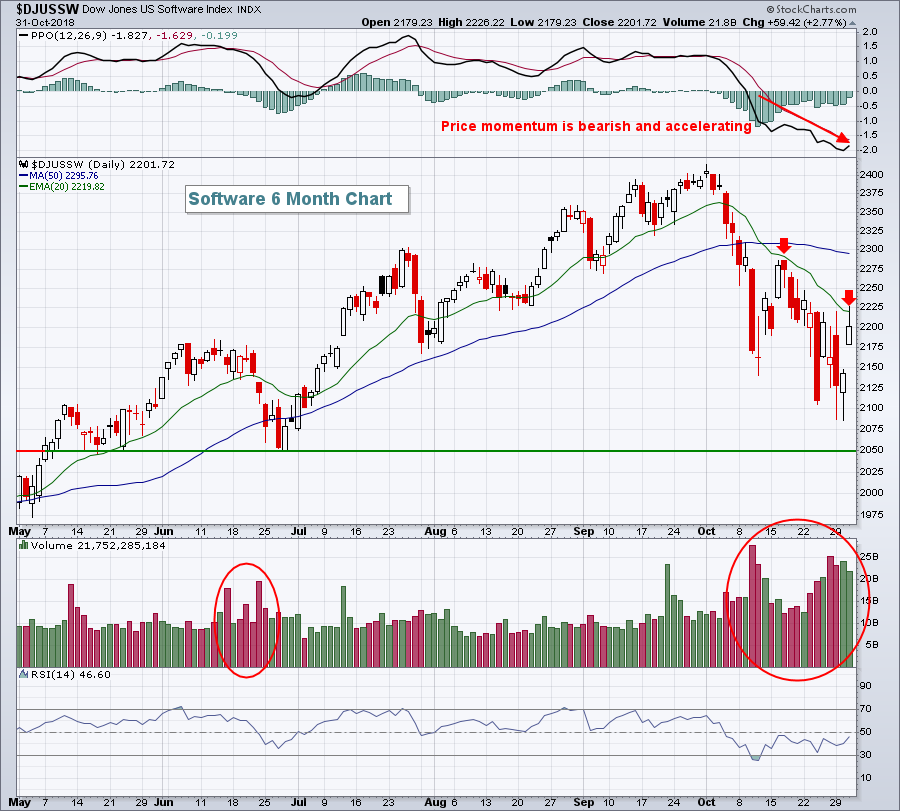 The negative and declining PPO tells us that the short-term 12 day EMA is below the longer-term 26 day EMA and the distance is widening. Typically, during such periods of selling acceleration, bounces are short-lived and many times find the 20 day EMA test (red arrows) to be a difficult obstacle. Breaking above the 20 day EMA certainly won't guarantee us that all is well in software stocks, but it's a necessary first step to begin to repair all the technical damage caused by the heavy volume selling from earlier in October.
To a lesser extent, we saw software stocks struggle in June. While the selling in October has been worse from a percentage standpoint, the good news is that those June price lows have not been violated. If the bull market remains intact, which I believe it will, look for the DJUSSW to perhaps consolidate over the next few weeks above those June lows.
Historical Tendencies
Western Digital (WDC) has been down more than 20% this week and is currently in a slide that began in March 2018 from the 105 level. WDC is down 60% since that time. Hopefully, seasonality can give WDC a lift. Over the past 20 years, the April thru October timeframe has been dismal, losing approximately 2.5% on average per year. But November begins a very strong historical period where WDC has enjoyed 25% gains on average each year during that period.
Key Earnings Reports
(actual vs. estimate):
ABMD: .81 vs .73
BCE: .74 vs .71
BLL: .56 vs .60
CHD: .58 vs .54
CI: 3.84 vs 3.45
CNQ: .85 vs .72
D: 1.15 vs 1.11
DWDP: .74 vs .71
EXC: .88 vs .88
IDXX: 1.05 vs .98
MPC: 1.70 vs 1.68
MPLX: .62 vs .58
PPL: .59 vs .56
RDS.A: 1.36 vs 1.43
SHPG: 3.65 - estimate, awaiting results
SPOT: .27 vs (.51)
TRP: .59 - estimate, awaiting results
ZTS: .83 vs .77
(reports after close, estimate provided):
AAPL: 2.79
ANET: 1.85
CBS: 1.22
ED: 1.48
EOG: 1.56
EQIX: 4.95
ES: .88
FTNT: .42
KHC: .81
LYV: .64
MELI: (.10)
MET: 1.25
SBUX: .59
Key Economic Reports
Initial jobless claims released at 8:30am EST: 214,000 (actual) vs. 212,000 (estimate)
Q3 productivity released at 8:30am EST: 2.2% (actual) vs. 2.3% (estimate)
October PMI manufacturing index to be released at 9:45am EST: 55.9 (estimate)
October ISM manufacturing index to be released at 10:00am EST: 59.1 (estimate)
September construction spending to be released at 10:00am EST: +0.2% (estimate)
Happy trading!
Tom
