Market Recap for Wednesday, January 2, 2019
On a day filled with hope, as traders rang in the new year on Wall Street, the biggest news came after the market closed as Apple (AAPL) warned regarding its upcoming quarter. During the trading day, we saw resiliency for one of the few times over the past five weeks. U.S. markets opened quite weak yesterday, but managed to attract buyers throughout the session as all of our major indices finished in positive territory, led by the more aggressive Russell 2000 and NASDAQ, which gained 0.54% and 0.46%, respectively. In terms of sector strength, energy (XLE, +1.97%) was the clear winner, benefiting from a surge higher in crude oil prices ($WTIC):
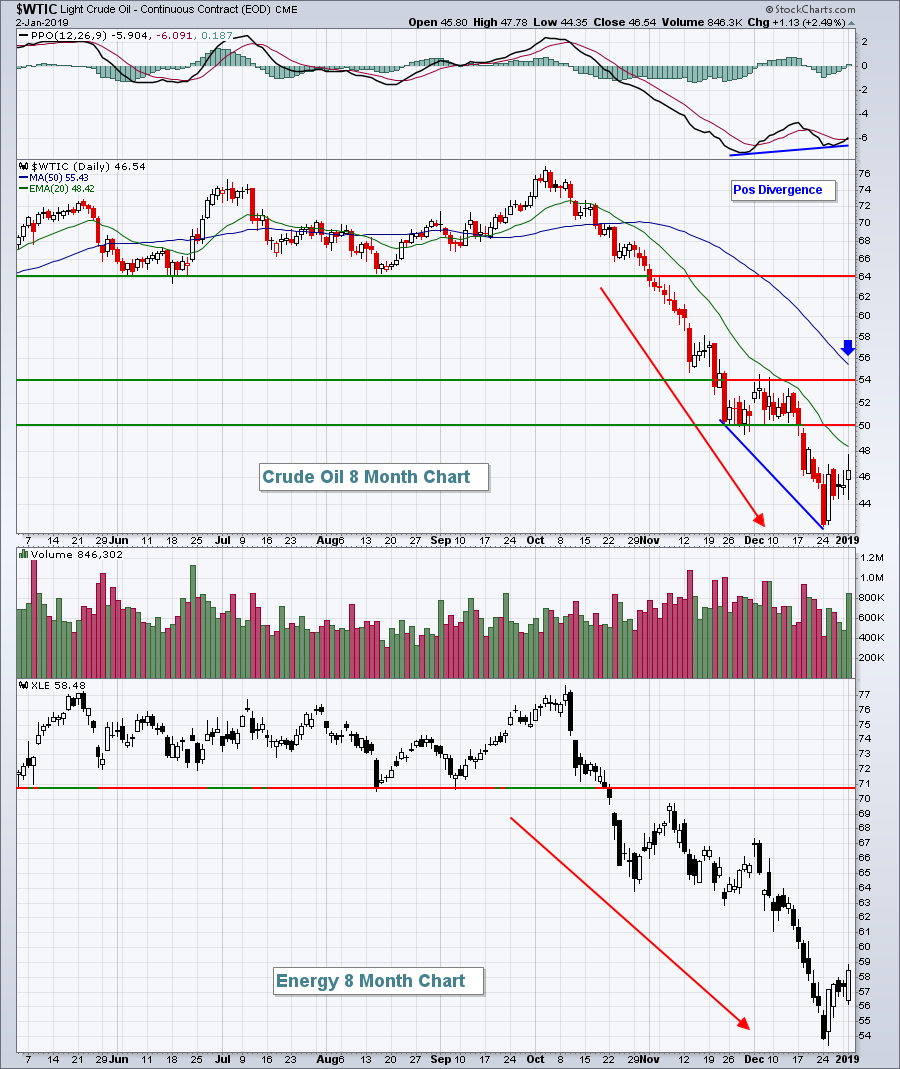 A positive divergence many times leads to a 50 period SMA test. The 50 day SMA is declining, but is currently just below $56 per barrel. The price chart shows congestion in the $50-$54 per barrel range so I would expect any rally to end in this range, at the same time intersecting that declining 50 day SMA. That would likely lead to more of a bounce in the XLE in the short-term.
Communication services (XLC, +1.33%) also had a strong day, but it too faces overhead resistance:
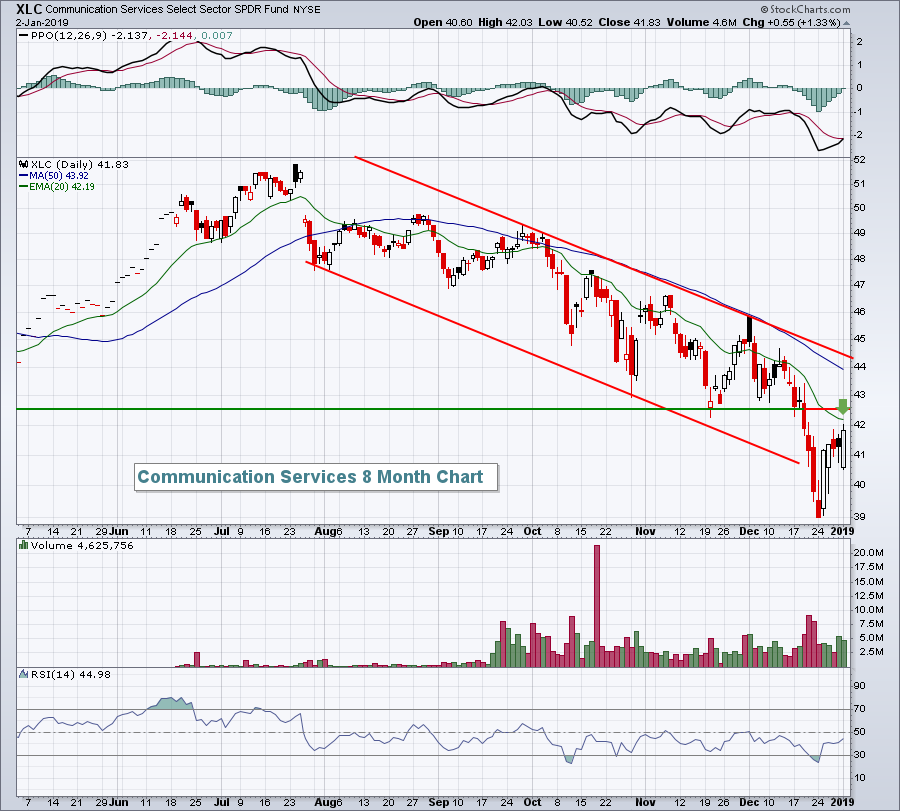
Heavy volume selling took the XLC below its recent down channel, but the recent oversold bounce has helped. Unfortunately, the XLC now faces a declining 20 day EMA, currently at 42.19 and price resistance near 42.50, established on the most recent price breakdown.
Defensive groups really struggled to open 2019 with real estate (XLRE, -2.29%), utilities (XLU, -1.72%) and healthcare (XLV, -1.51%) lagging the other sectors badly.
Pre-Market Action
After a "relatively" boring start to 2019 - still volatile, just no panic - the excitement may intensify today. Apple (AAPL) warned last night, citing a significant slowdown in China's economy, and initial jobless claims are on the rise, reported at 231,000 earlier this morning, well above expectations. The bulls have some news on their side as well as the December ADP employment report showed jobs at 271,000, nearly 100,000 higher than expected. What will traders do with this conflicting data and news?
Futures are pointing to opening weakness, although they're clearly off their earlier levels. With 30 minutes left to the opening bell, Dow Jones futures are lower by 223 points.
Overseas, Asian markets closed fractionally lower overnight, while European markets are down modestly. The German DAX ($DAX) is lower by roughly 1% at last check.
Current Outlook
When the S&P 500 lost its two key price support levels from February - closing price support at 2581 and intraday price support at 2532 - it resulted in overhead price resistance:
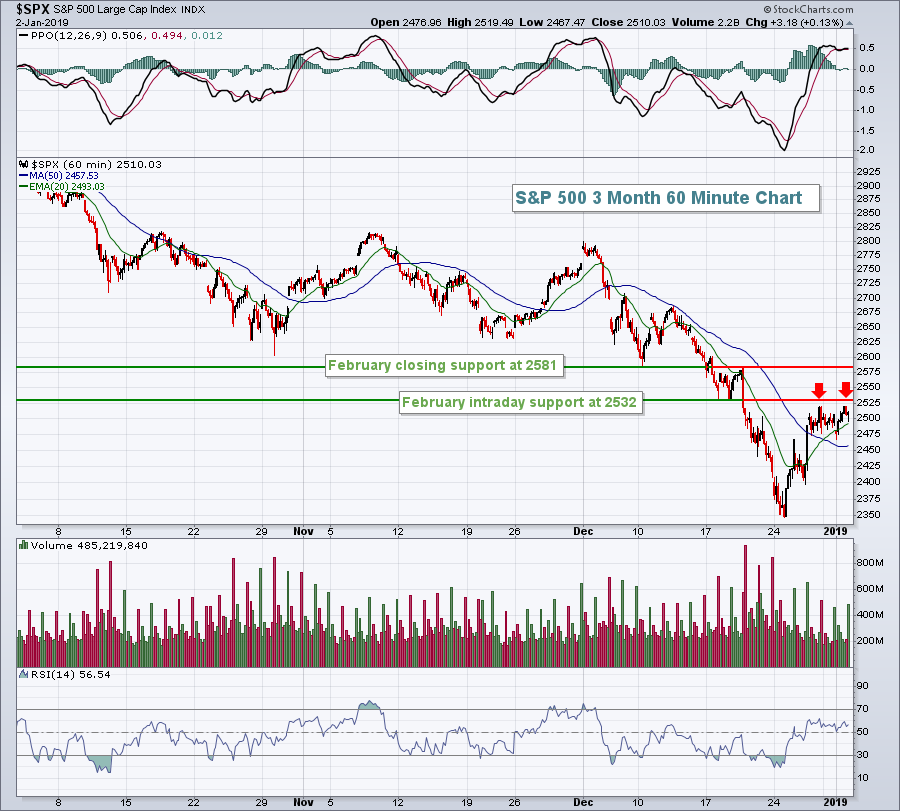 It's TA 101 - broken support becomes resistance. In December, when the Volatility Index ($VIX) hit 36, it reached the same level of panic and fear that we saw on initial bear market breakdowns in the past two bear markets and set the S&P 500 up for a relief rally. The following 3 month hourly chart shows that during our recent rally, our benchmark did approach the first of those two key price resistance levels. The ball dropped in Times Square on Monday night to ring in the new year. After hours last night, the bomb dropped on Wall Streeet as Apple (AAPL) warned about its upcoming quarterly results. Trust me, this won't be the last bomb dropped, but it might be the biggest one. Techicians essentially have a crystal ball as price action leads fundamental news.
Sector/Industry Watch
While it seems the bull market party has ended, there's one notable industry group that never really showed up to the party. It's automobiles ($DJUSAU). The group dropped 1.49% yesterday, but it's the long-term weekly chart that's so alarming:
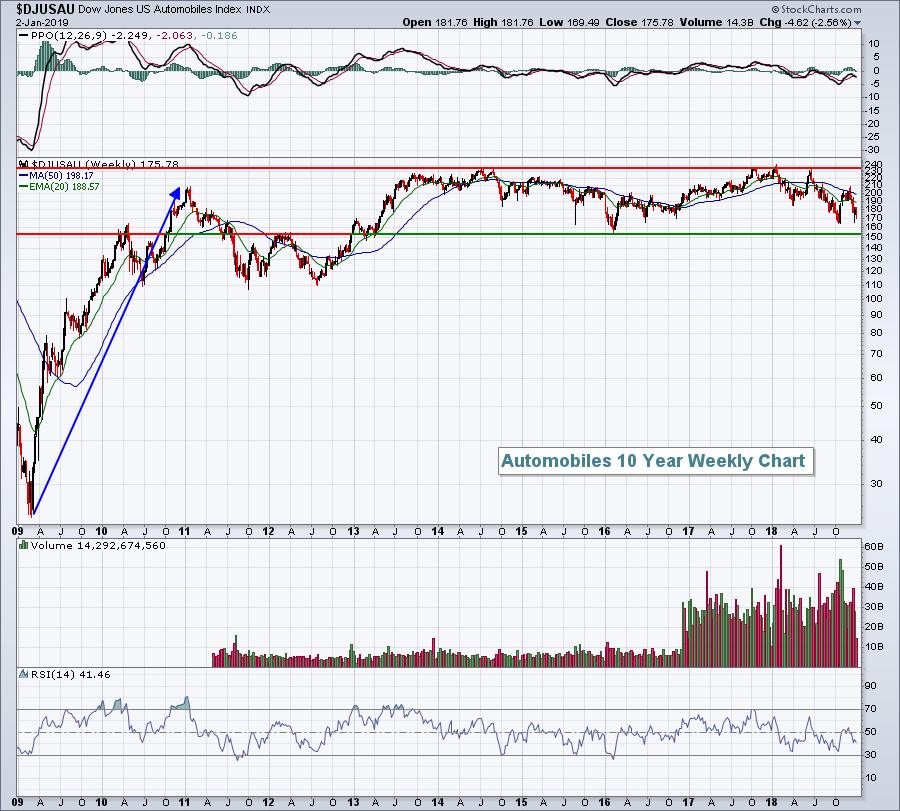 Autos had a massive rally at the beginning of 9 1/2 year bull market, but since has lagged the S&P 500 badly. Every time I think about trading an auto stock, other than Tesla (TSLA), I remind myself of the above chart and look away. Perhaps we'll see a bounce if the group tests price support closer to 150. Otherwise, it's a "no thank you" for me.
Historical Tendencies
Netflix (NFLX) gapped lower yesterday after an analyst indicated that the company will likely fall short of subscriber estimates in the upcoming quarter. NFLX did rally throughout the day, however, and finish unchanged to open 2019. While the chart is technically-damaged, NFLX has entered Q1, where it has been the best performing stock on the S&P 500 over the past two decades. NFLX has an average return of +27.6% during Q1 over this period, ahead of Booking Holdings (BKNG), which has gained an average of +22.0% in the first quarter since 1999.
Key Earnings Reports
None
Key Economic Reports
December ADP employment report released at 8:15am EST: 271,000 (actual) vs. 175,000 (estimate)
Initial jobless claims released at 8:30am EST: 231,000 (actual) vs. 217,000 (estimate)
December ISM manufacturing index to be released at 10:00am EST: 57.9 (estimate)
November construction spending to be released at 10:00am EST: +0.2% (estimate)
Happy trading!
Tom
