Market Recap for Friday, January 11, 2019
Healthcare (XLV, +0.33%) and consumer staples (XLP, +0.29%) paced a bifurcated market on Friday as the Russell 2000 eked out a 2 point gain. Despite rallying most of the session after a poor start, the Dow Jones, S&P 500 and NASDAQ fell short of moving into positive territory and finished with minor losses of 0.02%, 0.01%, and 0.21%, respectively. The Dow Jones ended with half of its components higher, half lower. Among sectors, five were higher, six were lower. Clearly, it was one of those kind of days.
Technically, it makes sense. We've seen close to an 11% rally on the S&P 500 off the late-December low and that's fairly normal for a bounce off a "correction to bear market", high volatility breakdown. Prior bear markets have seen anywhere from 7% to 13% rallies before turning lower again. That's what the bulls will be facing this week - limited upside and lots of downside - assuming that bear market headwinds kick in again. While we can never be sure, history suggests they'll kick in again.
While there are many mixed signals, I don't like that the 10 year treasury yield ($TNX) has begun to roll over again. The TNX hit 2.75% last week, but reversed and closed at 2.70% on Friday. This morning, in pre-market action, the TNX is down another couple basis points to 2.68%. Here's the current chart and what I'd look for:
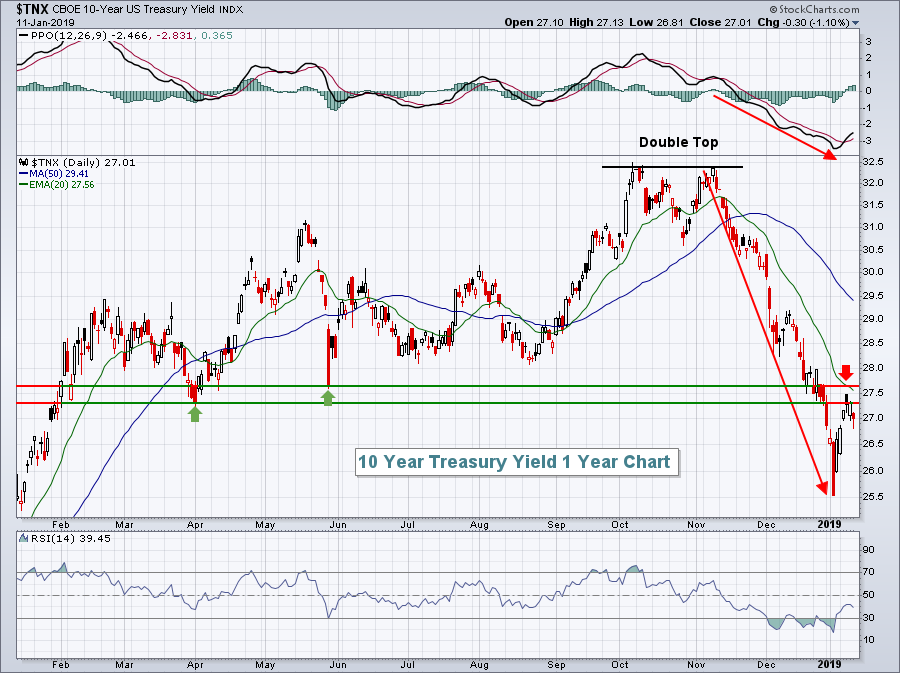 The April and May lows provided yield support. Once those two levels were broken, they became overhead yield resistance. Last week's high fell into the middle of this range as the TNX rolled over. The red arrow also highlights the declining 20 day EMA, which normally provides resistance as well. So from bullish equity perspective, I want to see the TNX clear 2.77%. That would suggest a more significant rotation from defensive treasuries to aggressive equities and would provide a much better opportunity for a sustainable stock market rally. Until then, I'll be skeptical.
Pre-Market Action
Bulls were resilient last week after gaps lower to start both Thursday's and Friday's trading sessions. They'll be under pressure again this morning, perhaps a bit more so, as Dow Jones futures are down roughly 200 points with just under 45 minutes left to the opening bell.
Crude oil ($WTIC) is down 1.38% this morning as it moves below $51 per barrel. The recent surge in crude oil prices have lifted energy (XLE), but that sector ETF is up against significant overhead resistance between 62-64. The XLE will likely need further gains in crude in order to pierce overhead price resistance.
Asian markets were mixed overnight and Europe is under moderate selling pressure this morning.
Current Outlook
One problem at the end of last week was that the S&P 500 struggled to move higher as leadership from aggressive areas waned. On Friday, as mentioned above, the XLV and XLP led among sectors and the NASDAQ lagged among major indices. That type of behavior suggests that traders are unwilling to commit to aggressive areas. Within consumer stocks, the XLY:XLP ratio is one that I follow closely and the relative strength of the more aggressive XLY appears to be turning down just as it hits overhead relative resistance:
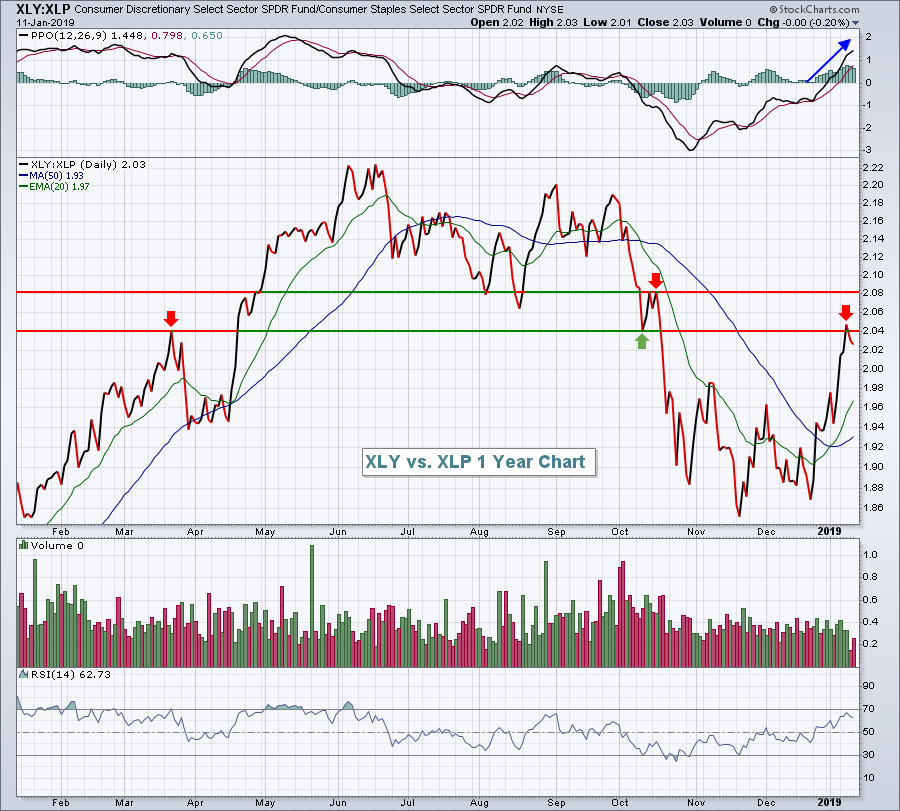 Throughout much of the 2018 rally, you can see this ratio climbing with many successful tests of the rising 20 day EMA. That's perfect market behavior and provides me much confidence that a rally is sustainable. However, notice that this ratio topped in June, well before the S&P 500 topped to begin Q4. While it's not the only signal to watch for market direction, I do believe it's a significant one as traders are effectively choosing whether to own more aggressive discretionary stocks (XLY) or defensive-oriented staples (XLP). The fact that this ratio appears to have topped is cause for concern and caution in the very near-term.
Sector/Industry Watch
Automobiles ($DJUSAU) had a fabulous week last week, soaring nearly 10%, and leading the consumer discretionary sector higher. But I rarely trade these stocks because their longer-term track record is uninspiring. Autos performed very well in the first couple years of the bull market (2009-2011), but since have delivered awful performance as you can see below:
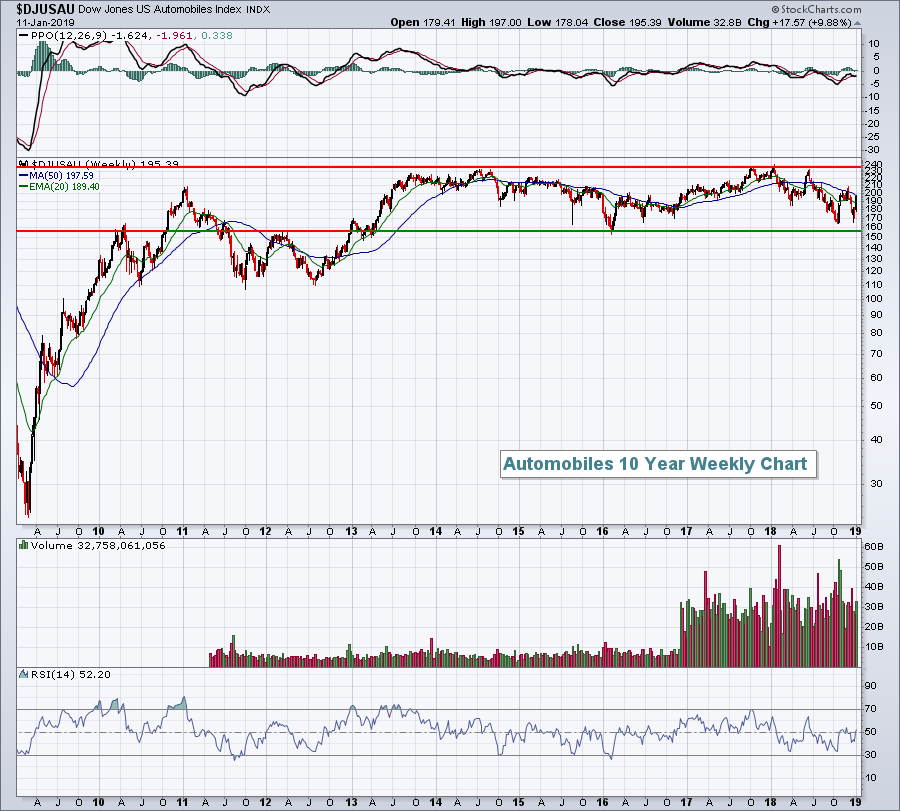 Honestly, if you looked only at automobiles since 2013, you wouldn't even know we were in a bull market. After last week's surge, the DJUSAU is now about equally distant from major support and major resistance, a very difficult level to decide on which way this group is about to move. I simply pass on trading autos.
Monday Setups
While I'd love to see the stock market continue its recent rally and move back into bull market mode, I don't believe that's the most likely scenario. Instead, I believe earnings season is going to test the bulls' resiliency to the max. The biggest two questions the market faces are (1) Have the Q4 woes been fully priced in?, and (2) Will a number of influential companies lower their forecasts for their next quarter and/or for fiscal year 2019? At this particular point in time, I'd rather err on the short side, so that's my focus for this week's setups.
I'll go with Baker Hughes, Inc. (BHGE), which fell short on its revenues and EPS when it reported its last quarterly earnings on October 30th. We've seen a recent bounce on light volume and we're close to key reaction price highs in November and early December:
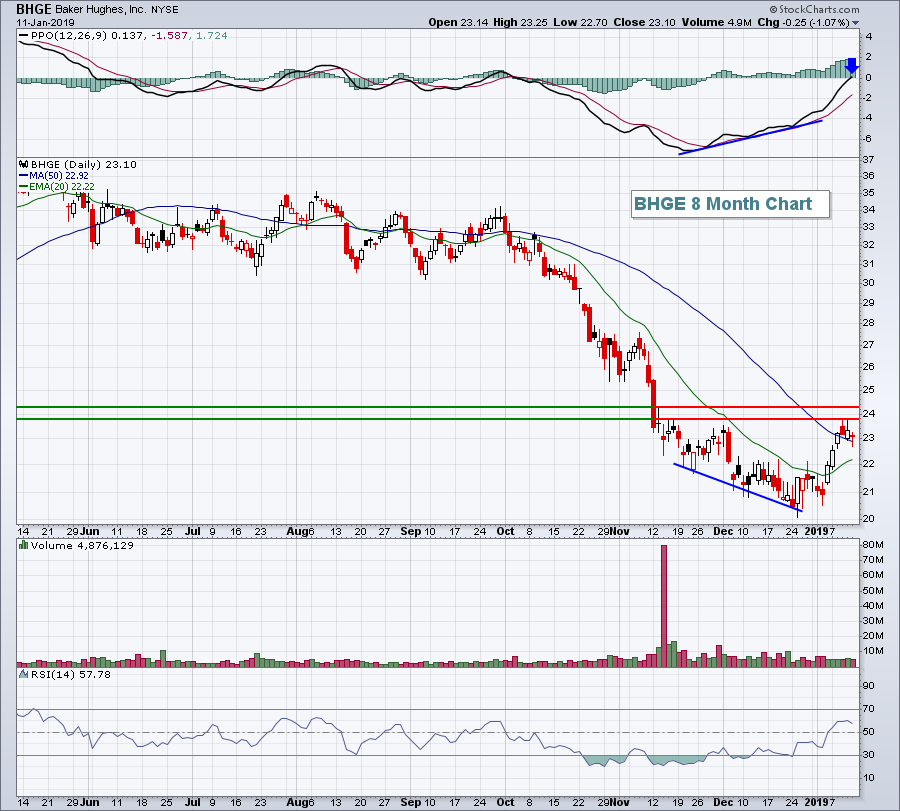 The blue lines highlight the positive divergence as BHGE showed slowing momentum to the downside. I look for strength to "reset" the PPO at its centerline (blue arrow) and for potentially a 50 day SMA test as well. We've seen both on BHGE after nearly a 20% rally from 20 to 24. The rally came on light volume, however, and I'm expecting further selling here as we approach BHGE's next quarterly earnings report in a couple weeks.
Historical Tendencies
While bank ($DJUSBK) earnings will be in the spotlight this week, it's noteworthy that January and February are the only two consecutive calendar months where the group has produced negative average monthly returns over the past two decades:
Average monthly returns:
January: -0.9%
February: -1.5%
Key Earnings Reports
(actual vs. estimate):
C: 1.61 vs 1.55
SJR: .27 (estimate, awaiting results)
Key Economic Reports
None
Happy trading!
Tom
