Market Recap for Friday, February 8, 2019
Friday was a solid day for the bulls. It wasn't because we saw large gains, because we didn't. In fact, it was bifurcated action where the S&P 500, NASDAQ and Russell 2000 barely closed higher with gains of 0.07%, 0.14% and 0.05%, respectively. The Dow Jones failed to break into positive territory, instead dropping 0.25%. But the bullishness came from three key developments:
(1) First, the reversal occurred near very important short-term support on the S&P 500. In other words, there were buyers as the bears attempted to put the "pedal to the metal":
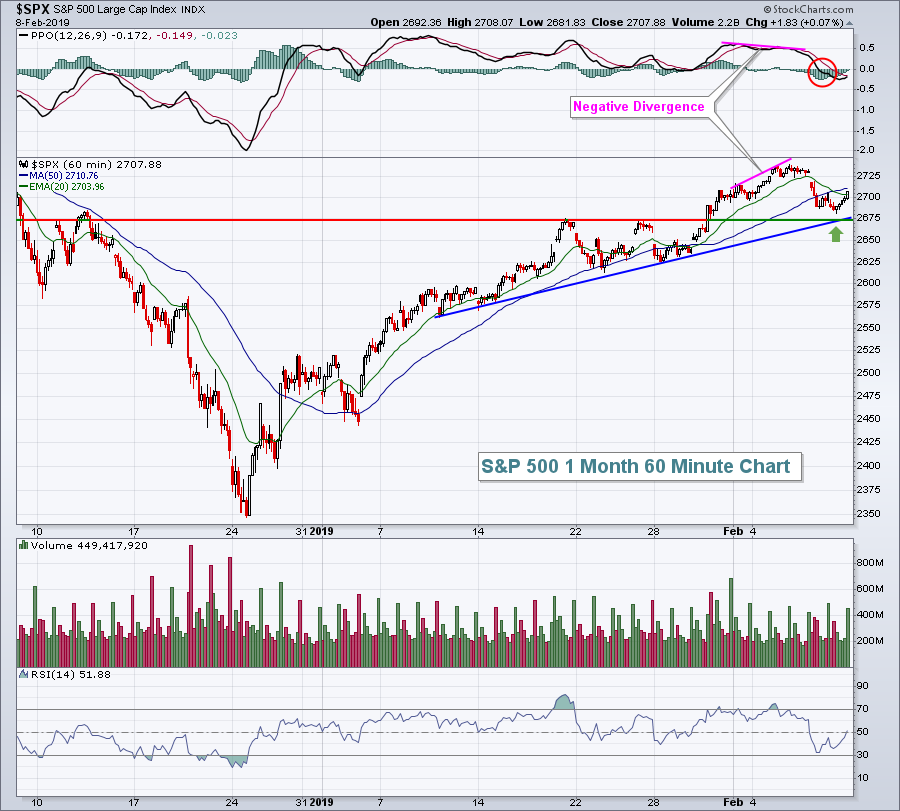 I loved the fact that the S&P 500 was able to rally and close back above the 20 hour EMA. Also, holding price and trendline support near 2675 was a bullish development as well.
(2) Volatility ($VIX) neared 18, but quickly reversed and once again closed beneath 16, which served as ultimate support during previous bear markets. Fear is a necessary ingredient of a bear market and it's dissipating, very bad news for those in the bearish camp.
(3) Leadership on Friday. As buyers returned late in the day, so to did "risk on" action. While financials (XLF, -0.50%) clearly continue to struggle from a declining TNX, which closed at its lowest level in 6 weeks on Friday, other aggressive areas like communication services (XLC, +0.68%) and technology (XLK, +0.58%). The former bounced once again off rising 20 day EMA support, a hallmark of a rally:
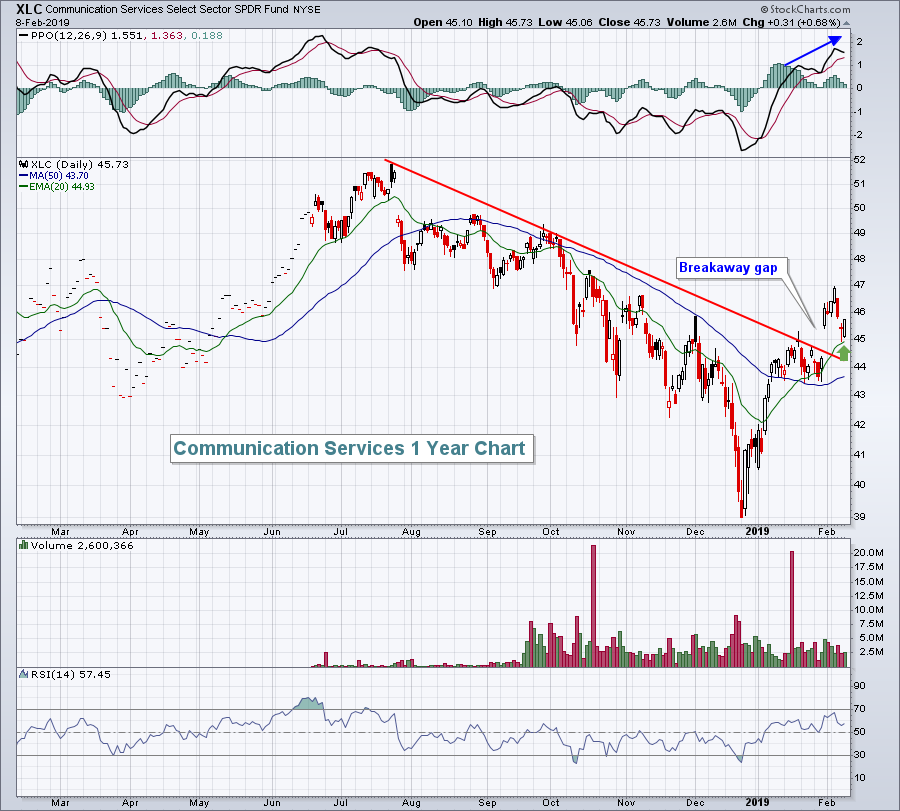 The PPO here looks strong and the bounce off 45 came at price and 20 day EMA support. Until we begin to see these bullish signals reverse, it's difficult not to be on board this rally.
Pre-Market Action
Asian markets were mostly higher overnight as optimism apparently grew over trade talks between the U.S. and China. That strength carried over into Europe as key indices there are quite strong this morning. All of that turned negative futures positive as Dow Jones futures are currently higher by 106 points with roughly 30 minutes left to the opening bell.
The 10 year treasury yield ($TNX) is moving in the right direction, up 3 basis points to 2.66% this morning. This is key as the TNX closed at a 6 week low on Friday. So while the S&P 500 has been strong during this period, it has little to do with rotation from bonds to stocks. The good news for bullish equity traders is that if significant rotation from bonds to stocks were to take place, a sustainable rally would likely be here to stay.
Crude oil ($WTIC) is down just under 1% to $52.32 per barrel and gold ($GOLD) is having a rough morning, lower by $10 to $1308.50 per ounce. I wouldn't grow overly concerned about GOLD unless the $1290-$1300 support area is lost. The U.S. Dollar Index ($USD) has been quite strong of late, however, and its strength this morning is weighing on commodities. The UUP (dollar proxy) will be looking for its 8th consecutive daily gain today.
Current Outlook
While many signals have turned bullish during this 6-7 week advance, one to definitely watch is the performance of transports ($TRAN). It's very difficult to buy into the strengthening economy argument, which would be bullish for equities, when transportation stocks are not helping to lead equities higher:
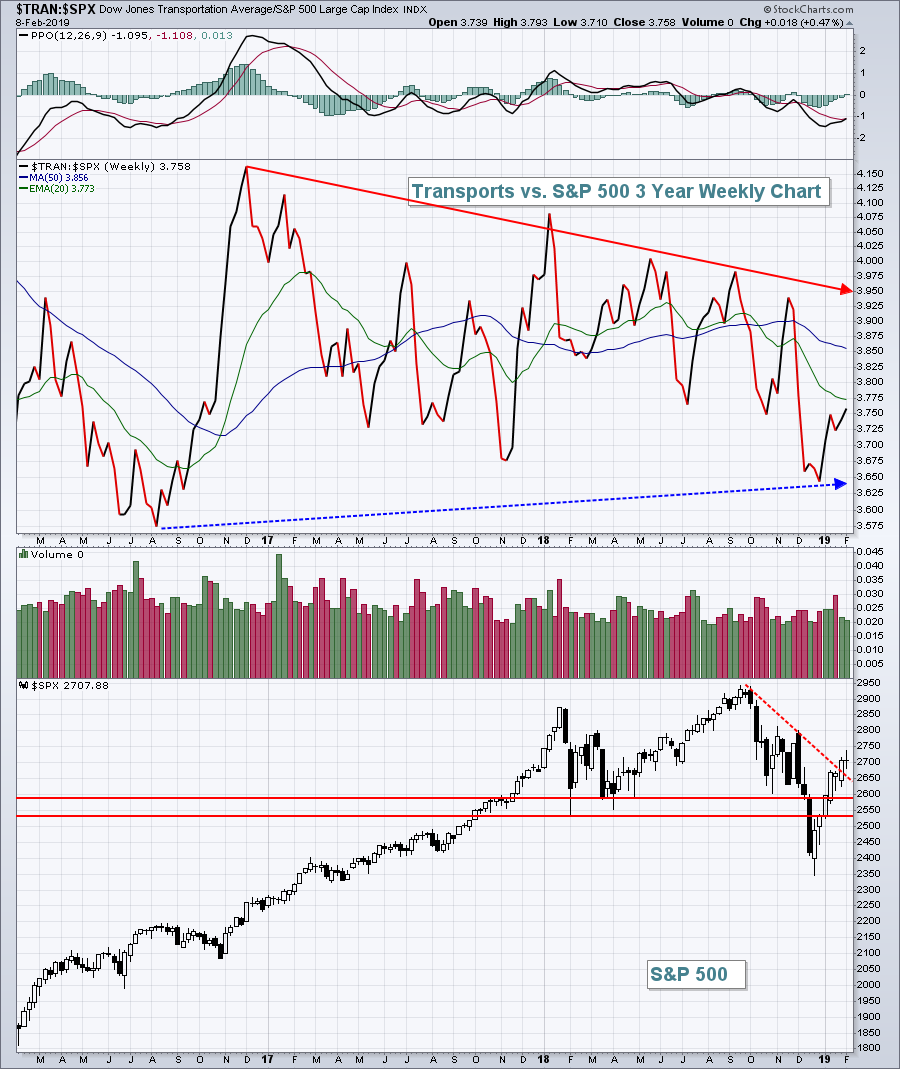 Don't misunderstand me. Transports have risen nicely since the December low, although their absolute performance is not reflected above. But the problem is that transports have struggled on a relative basis. They were clobbered on a relative basis during the December massacre, but have not regained much of their relative strength since then. The combination of the 10 year treasury yield ($TNX) languishing near 2.65% - well below their 3.25% high in Q4 2018 - and the lack of relative strength in transportation stocks suggests that even the most bullish investors/traders respect the message being sent. For me, that means to pay attention if short-term support levels (ie, 20 day EMA) fail to hold.
Don't try be a hero.
Sector/Industry Watch
Energy (XLE, -3.01%) was easily the weakest sector last week, but the reversal and hammer on Friday provides short-term hope for the group:
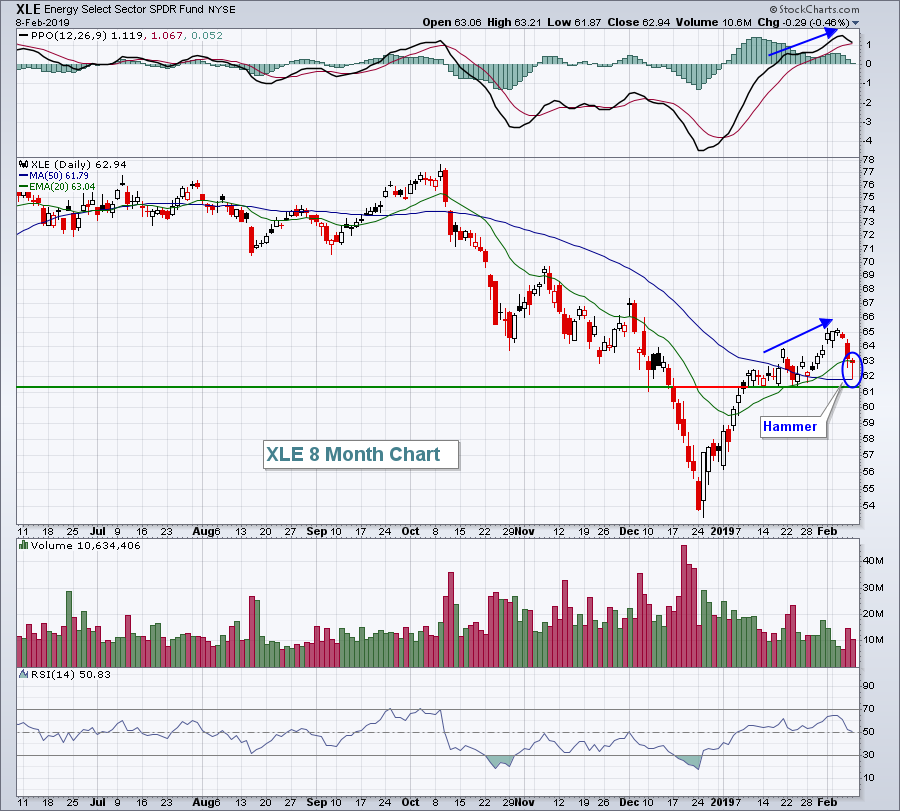 As price has risen, so too has the PPO (blue directional lines). Typically, the rising 20 day EMA provides support during such periods and Friday's hammer candle at that key moving average is noteworthy, and potentially a reversing signal. We do need to keep an eye on crude oil ($WTIC) and make sure it holds recent support near $50.50-$51.00 per barrel. Also, the XLE's price support is just above 61.00. Loss of both support levels would be short-term reason to exit energy - in my opinion, of course.
Monday Setups
I like several stocks this week, but my choice is going to be Bank of America (BAC). It's been among the best performing banks and its quarterly results a few weeks back justifies its relative strength. BAC beat both revenue ($22.73 bil vs. $22.21 bil) and EPS ($.70 vs. $.63) estimates handily and saw a very bullish response by traders, gapping higher and continuing its advance for two weeks with several hollow candles. A hollow candle forms when the daily close is above the daily open. It's an indication of solid demand and potential institutional accumulation because of the unusually high volume. Here's the chart:
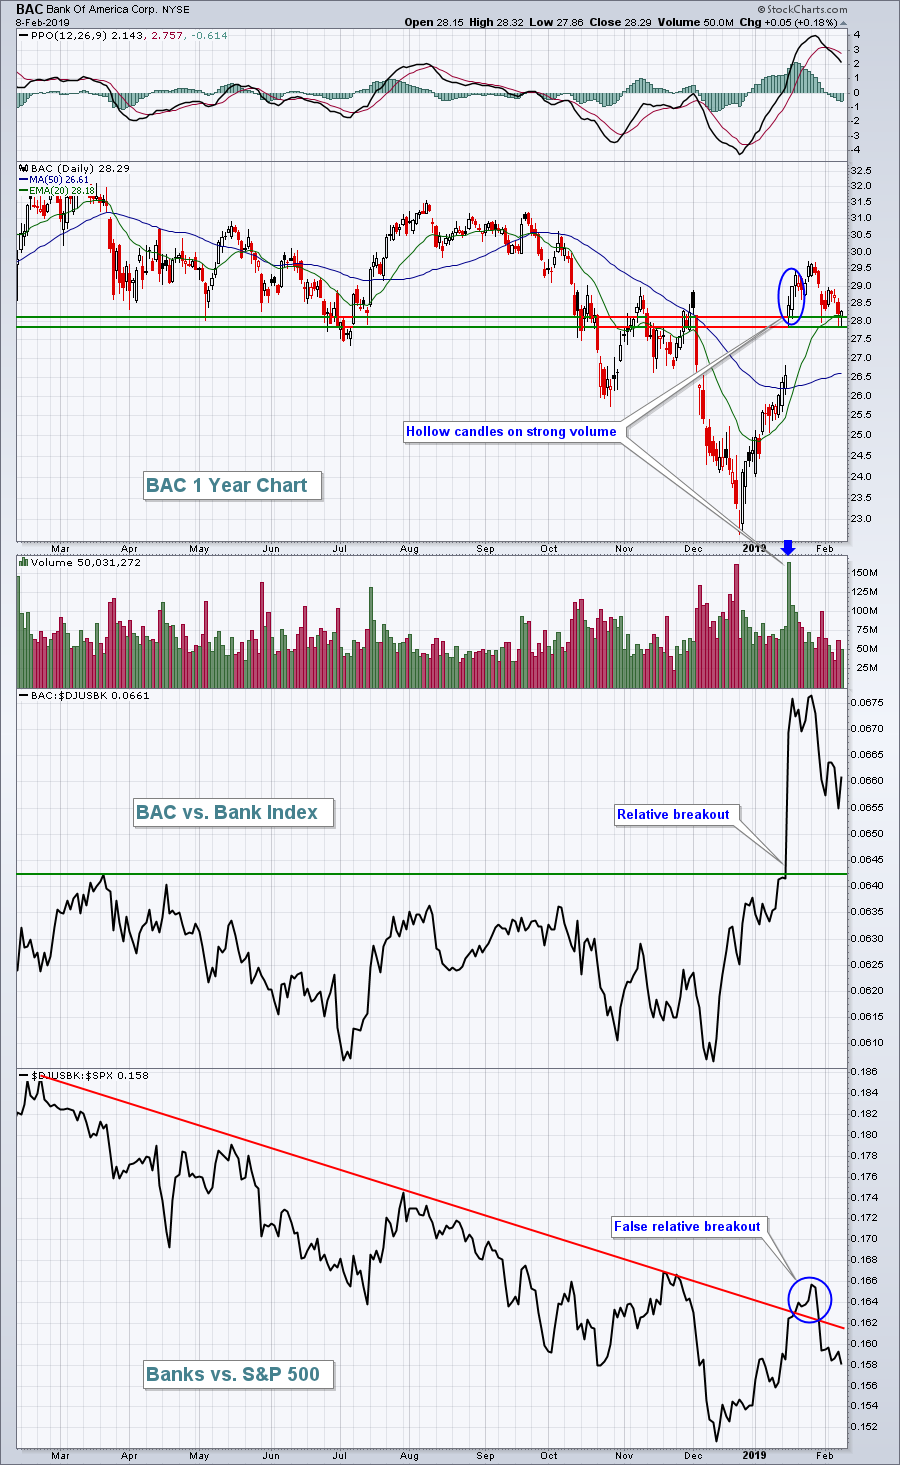 I like entry from the current price down to 27.90 with a closing stop beneath 27.75. I believe there's 10-15% upside over the next few months, especially if the 10 year treasury yield ($TNX) moves higher. Higher yields tend to provide tailwinds for financial stocks in general, and banks more directly.
Historical Tendencies
Looking ahead, the S&P 500 typically enjoys bullish performance during March and April as these two months have produced annualized returns of +13.90% and +16.86%, respectively, since 1950. The S&P 500 has risen during April 49 of the last 69 years, which trails only December (51 of 69) in that category.
Key Earnings Reports
(actual vs. estimate):
CNA: (.08) vs .81
KMPR: .91 vs .77
L: .36 vs .53
QSR: .68 vs .67
(reports after close, estimate provided):
BRKR: .54
FMC: 1.49
MOH: 1.52
OHI: .76
RE: (4.56)
RNG: .18
VNO: .99
Key Economic Reports
None
Happy trading!
Tom
