Market Recap for Thursday, January 31, 2019
Wall Street surged again on Thursday, buoyed by additional strong earnings reports and surprisingly strong forecasts by a couple of influential names. Facebook (FB, +10.82%) and General Electric (GE, +11.65%) were two of the leaders on the S&P 500. It's somewhat ironic as both had been blamed for dismal performance in 2018. On Thursday, however, all was forgiven and forgotten as these two helped the S&P 500 and NASDAQ to post 0.86% and 1.37% gains, respectively. The Russell 2000 chipped in 0.84%. Only the Dow Jones finished in negative territory, dropping a meager 15 points. Technically, the best news is the current positioning of price vs. now-rising 20 week EMAs. Barring a major reversal today, all of our major indices will post a weekly close above their respective 20 week EMAs. Here's an update on the benchmark S&P 500:
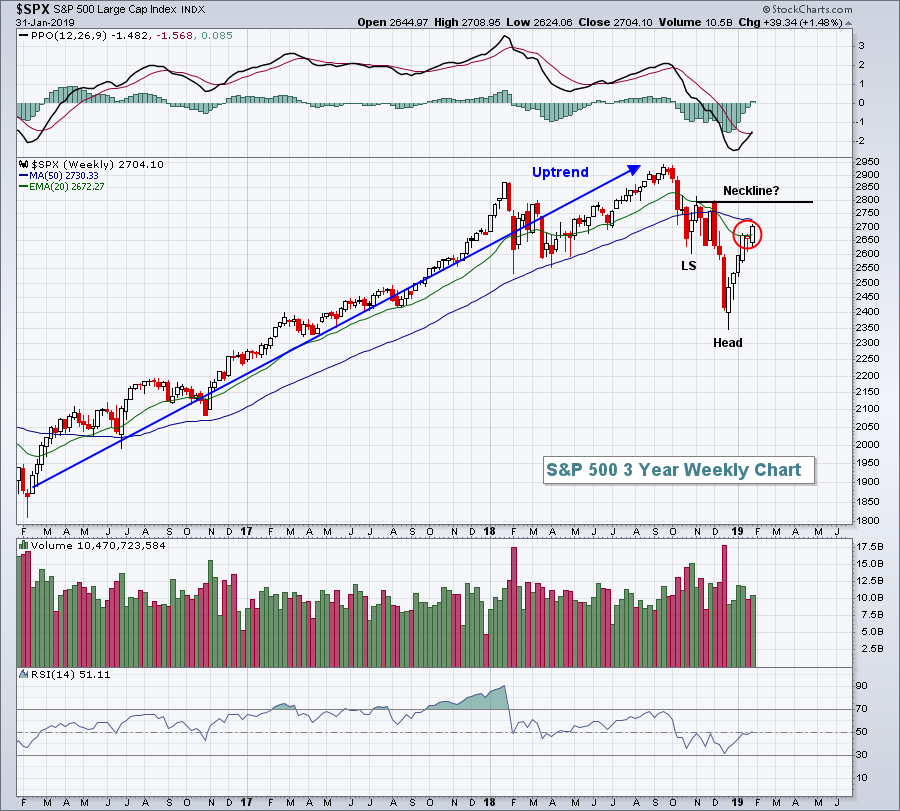 The red circle highlights the current break above the 20 week EMA, although this candle isn't final until today's close. Again, barring a major reversal, it appears the S&P 500 will clear its 20 week EMA, a huge step in repairing its chart technically.
Due to the huge response to FB's earnings report, the communication services sector (XLC, +4.08%) was easily the top performing sector and internet stocks ($DJUSNS, +4.99%) was the best performing industry group. It came at an opportune time as the XLC had been lagging other aggressive sectors rather badly. It was another "kick save" in what's been a series of kick saves in the current rally. Utilities (XLU, +2.11%) was the second best performing sector as this group benefited by falling treasury yields. More on the falling yields, and what that might mean, in the Current Outlook section below.
Pre-Market Action
Perhaps the most shocking development yesterday was the sharp turn lower in the 10 year treasury yield ($TNX). Well, this morning's bond market reaction to a stunningly bullish jobs report might top it. After crushing nonfarm payroll estimates, the TNX yawned and is up just 1 basis point this morning at 2.65%. What does the bond market see that we're not seeing? One possible explanation is that the December jobs report, which was shockingly bullish as well, saw a significant revision lower from 312,000 to 222,000.
Asian markets were mixed overnight and European markets are fractionally higher this morning. Dow Jones futures are pointing to a solid open, up roughly 75 points with the opening bell just 30 minutes away. NASDAQ futures are weaker as traders digest a disappointing quarterly report by Amazon.com (AMZN), which is down 4.3% in pre-market action.
Current Outlook
The bond market and stock market have been diametrically opposed over the past week or so and it's likely to get rectified very soon. Treasury prices have been rising along with equity prices and, with the exception of quantitative easing (QE) several years ago, it's quite unusual. As our economy strengthens or is expected to strengthen, treasury prices drop (and corresponding yields rise) as an expanding economy results in higher profits for S&P 500 companies. Accordingly, money rotates away from more defensive treasuries and into more aggressive stocks. As treasuries are sold, it sends their yields higher as treasury prices and yields always move inversely to one another. Therefore, treasury yields and the benchmark S&P 500 tend to move in the same direction and the correlation coefficient confirms this short-term positive correlation.
But........take a look at this chart:
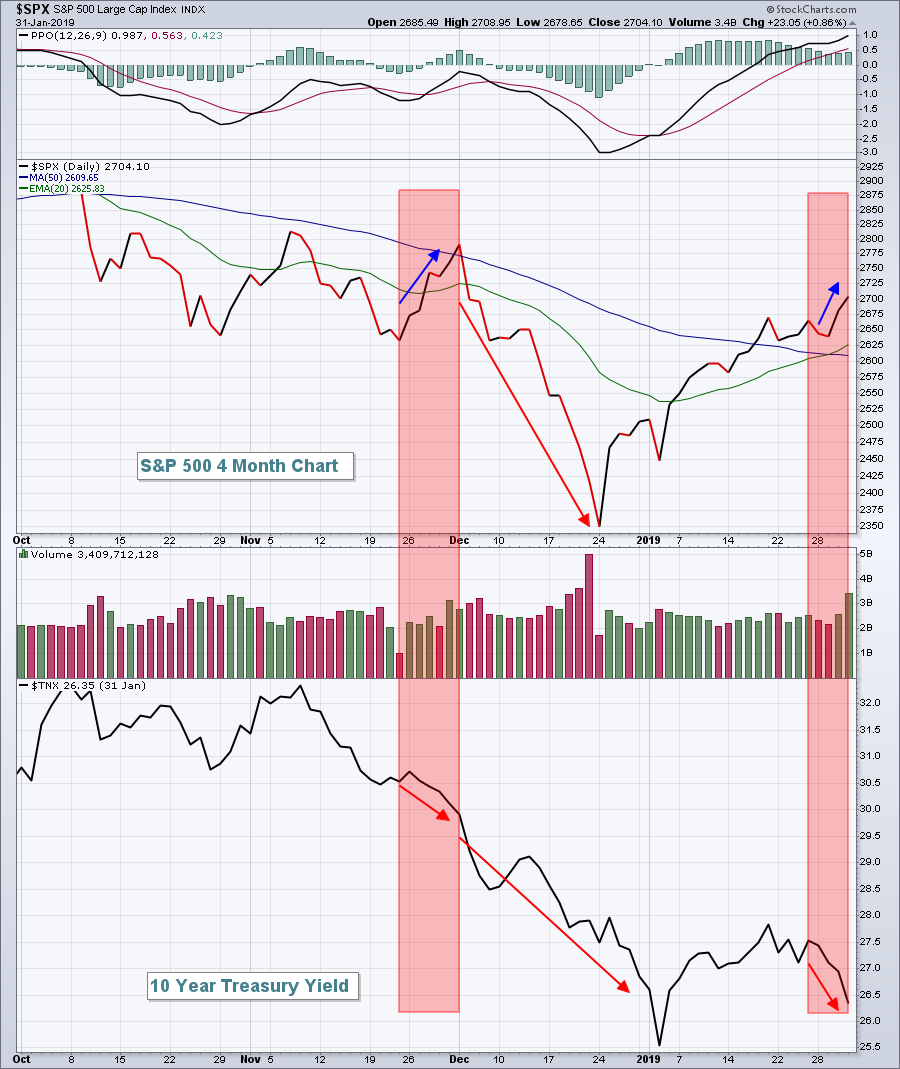 In late-November, the SPX was rising while the TNX was tumbling, providing mixed signals on our economy. Eventually, the bond market was proven correct and the SPX tumbled as well. Now look at the past week's action. It's happening again. The bond market looks ahead and doesn't appear to like what it's seeing, while the stock market continues its rapid ascent.
What gives? We'll likely soon find out as one or the other plays catch up. The bulls are hoping it's money leaving the bond market and helping to further fuel the stock market's current rally.
Sector/Industry Watch
DowDuPont (DWDP, -9.23%) reported less than stellar results yesterday, missing both its revenue and EPS forecasts for the last quarter, and it was punished, taking down the commodity chemicals index ($DJUSCC) in the process. The DJUSCC has been a relative underperformer, but had begun to strengthen. The DWDP earnings report may be the cause for a significant reversal:
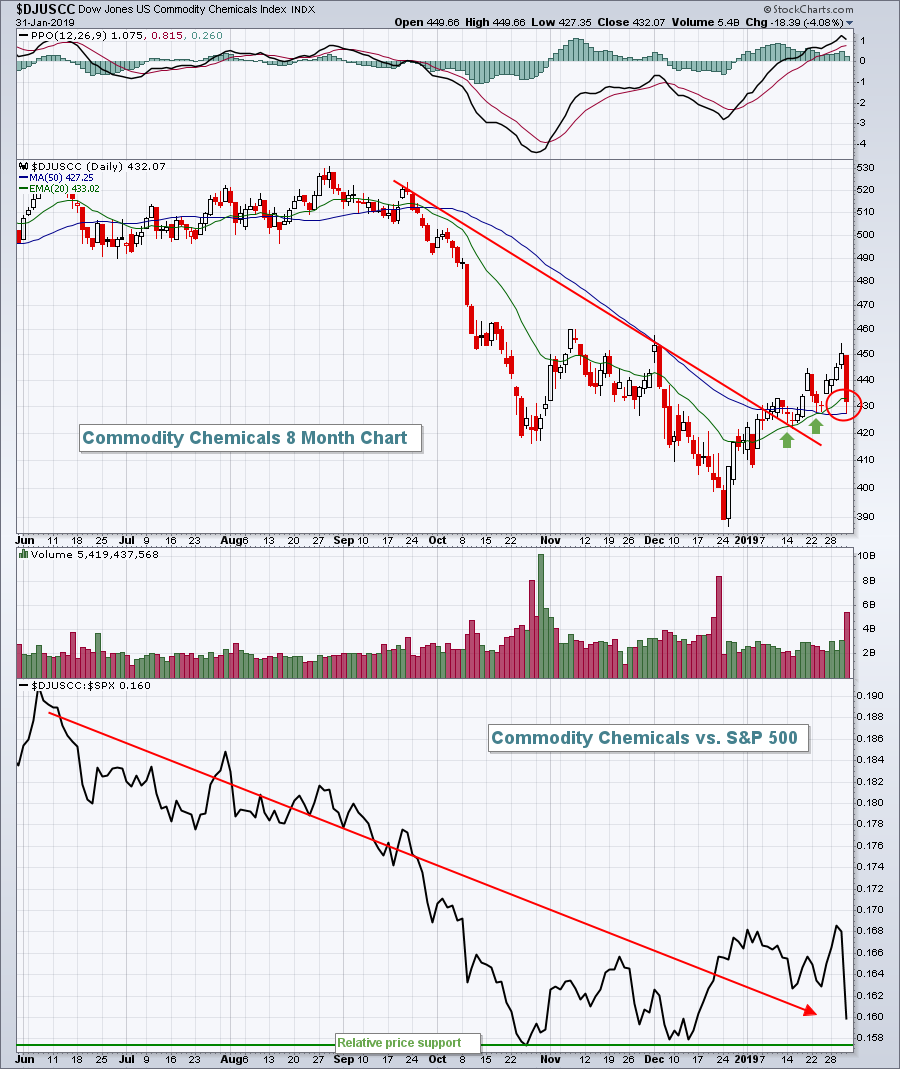 The downtrend appeared to be broken a few weeks back and rising 20 day EMA tests (green arrows) since then had been successful. Unfortunately, with DWDP's news, the index fell on Thursday to close fractionally beneath that key moving average (red circle). The relative strength line also took a serious hit and isn't far from challenging the relative price low set back in October and tested in December.
Historical Tendencies
1-800-Flowers.com (FLWS) posted excellent quarterly results and raised their FY19 forecast, sending its shares higher by nearly 20% yesterday. The even better news, perhaps, is that FLWS absolutely loves the next few months from a seasonal perspective. From February through April, FLWS has averaged gaining nearly 15% over the past 20 years.
Key Earnings Reports
(actual vs. estimate):
AON: 2.16 vs 2.13
CI: 2.46 vs 2.53
CVX: 2.06 vs 1.87
D: .89 vs .91
HMC: .85 vs .85
HON: 1.91 vs 1.88
IDXX: .98 vs .90
IMO: .58 (estimate, awaiting results)
ITW: 1.83 vs 1.82
JCI: .26 vs .24
KKR: .55 vs .49
LYB: 1.83 vs 2.13
MRK: 1.04 vs 1.03
ROP: 3.22 vs 3.13
SNE: 2.93 vs 1.90
SPG: 3.23 vs 3.24
WY: .10 vs .11
XOM: 1.51 vs 1.08
ZBH: 2.18 vs 2.18
Key Economic Reports
January nonfarm payrolls released at 8:30am EST: 304,000 (actual) vs. 158,000 (estimate)
January private payrolls released at 8:30am EST: 296,000 (actual) vs. 160,000 (estimate)
January unemployment rate released at 8:30am EST: 4.0% (actual) vs. 3.9% (estimate)
January average hourly earnings released at 8:30am EST: +0.1% (actual) vs. +0.3% (estimate)
January ISM manufacturing index to be released at 10:00am EST: 54.0 (estimate)
November construction spending to be released at 10:00am EST: +0.2% (estimate)
January consumer sentiment to be released at 10:00am EST: 91.4 (estimate)
November wholesale inventories to be released at 10:00am EST: +0.4% (estimate)
Happy trading!
Tom
