Market Recap for Monday, March 11, 2019
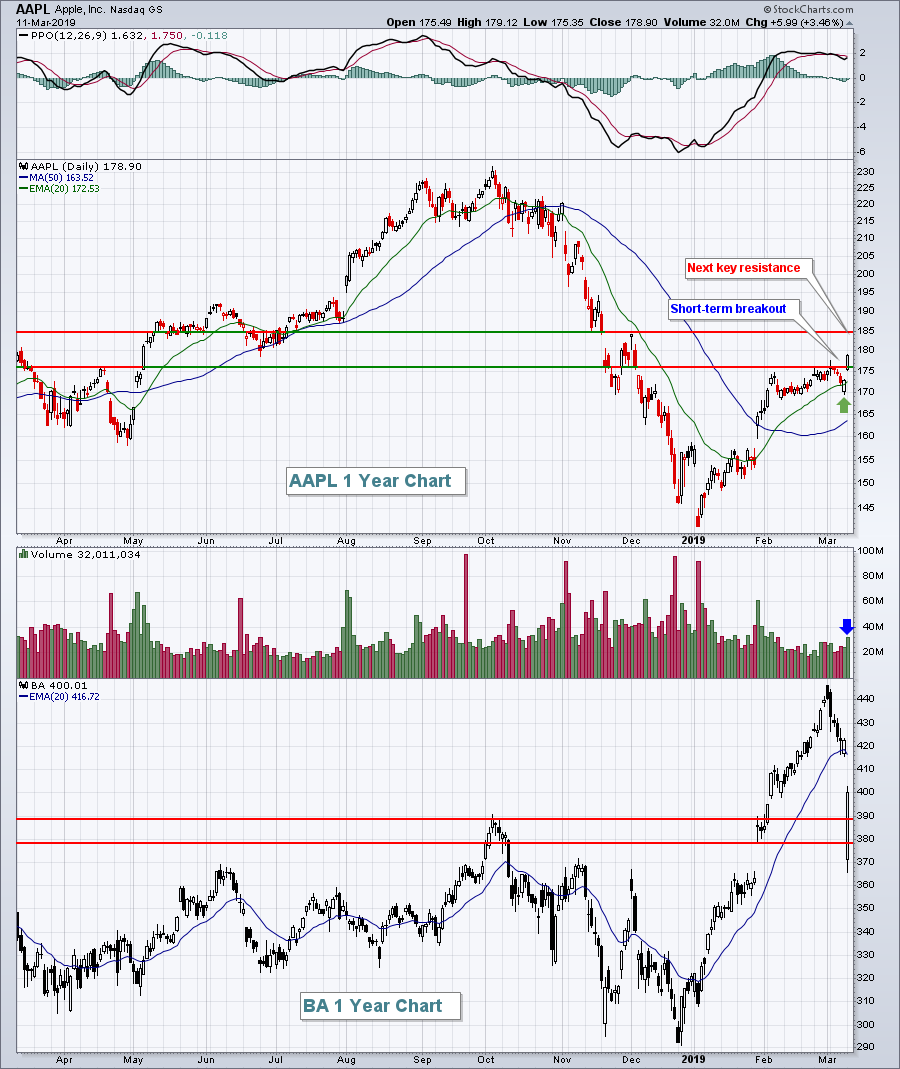
It never hurts to have Apple, Inc. (AAPL, +3.46%) breakout and that's what happened on Monday. It not only lifted the technology sector (XLK, +2.15%), but it provided a spark to our major indices as we experienced a "trend" day, where we opened higher and built on those opening gains all day long. The NASDAQ leapt 2.02% to claim the top index prize, but the Russell 2000 and S&P 500 weren't too far behind with gains of 1.77% and 1.47%, respectively. The Dow Jones, impacted by a very poor showing by Boeing (BA, -5.33%), climbed a much-lesser 0.79%. 29 of 30 Dow components advanced, as did all 11 sector ETFs, so participation was quite wide. AAPL and BA were the best and worst of the Dow yesterday, but even BA rallied nicely after being down more than 12% in pre-market action:
 The short-term breakout in AAPL will likely result in a test of overhead price and gap resistance near 185. As for BA, the recovery was extremely bullish with a long hollow candle printing on Monday. But it is now below its 20 day EMA, so that will be the next hurdle technically. Buying resumed on BA from yesterday's low of 365.55, so that is a major price support level now, in my view. The gap lower on BA was the result of another plane crash over the weekend involving its 737 MAX aircrafts. It was the second crash in the last six months and the plane's safety will draw much scrutiny for the foreseeable future.
Retailers (XRT, +1.83%) were generally quite strong yesterday after the January retail sales report came in much stronger than expected. Stripping out autos, January retail sales rose 0.9%, well ahead of the expected 0.3%. Three of the top four industry groups within consumer discretionary were retail-related with autos ($DJUSAU, +1.91%) the other group.
Pre-Market Action
Overall, U.S. stock futures look solid this morning, despite an anticipated opening drop in the Dow Jones. For the second straight morning, weakness in Boeing (BA) shares is hurting Dow futures, which are currently lower by 33 points with 30 minutes left to the opening bell. Both S&P 500 and NASDAQ futures, however, are modestly higher.
The 10 year treasury yield ($TNX) is flat near the 2.63% support level that it's been holding for the last six weeks. Long-term yield support is close to that 2.60% level and we saw a quick drop to 2.55% in early January. It truly would not be a good signal for the TNX to fall beneath 2.55%.
Gold ($GOLD) is up this morning near the $1300 per ounce area. GOLD has yet to close above $1300 per ounce in March. GOLD also has moving average resistance at 1303 (50 day SMA) and 1305 (20 day EMA), respectively.
Current Outlook
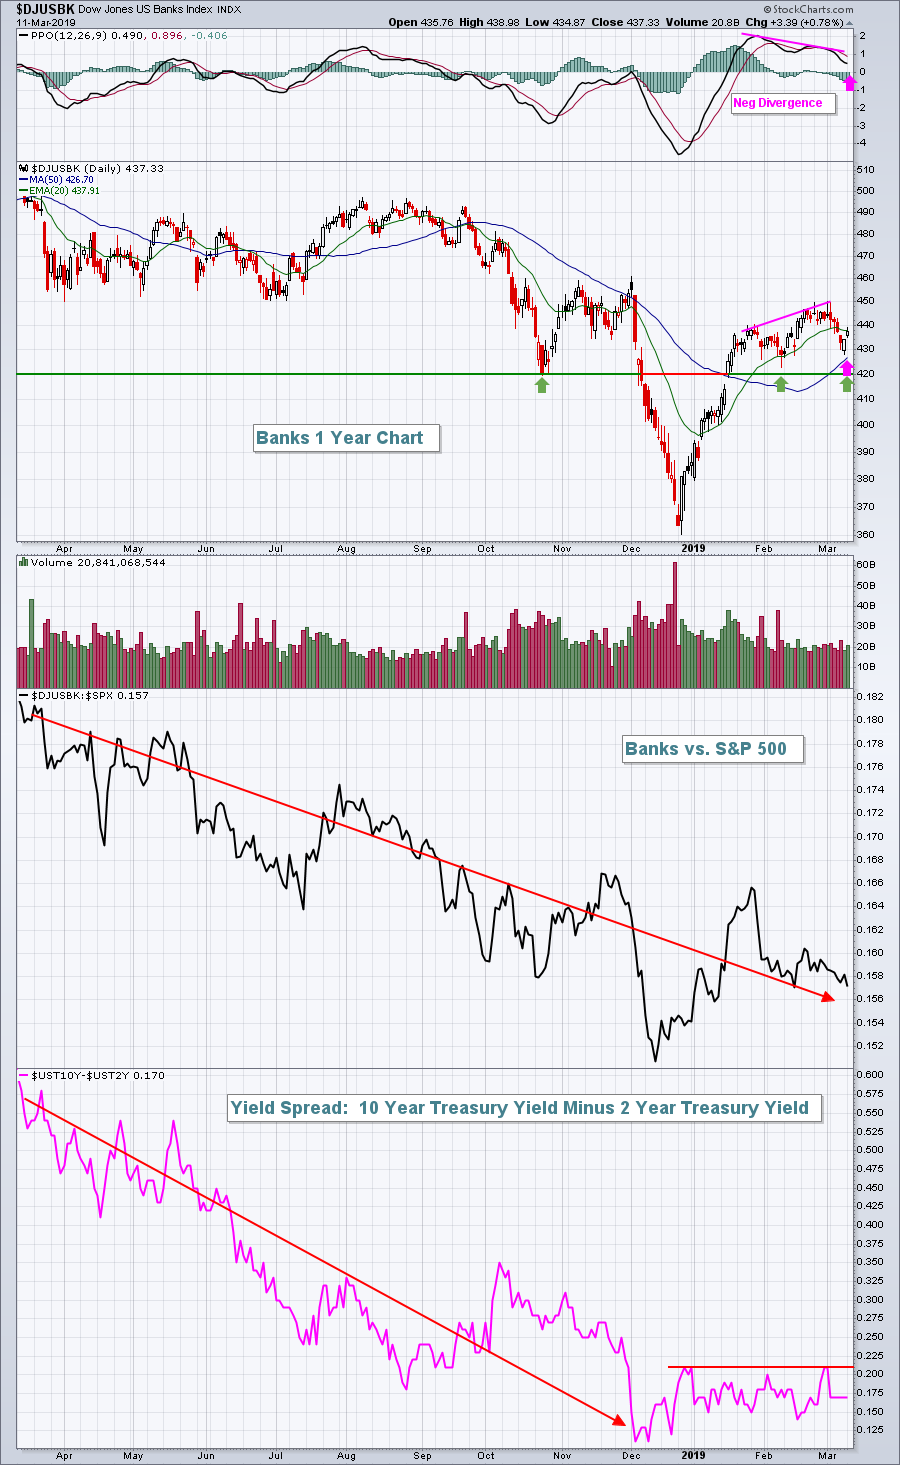
I've discussed the potential problems of a stock market rally without an accompanying rise in treasury yields. It simply sends a mixed message. A rally in U.S. equities would suggest that profits will climb, and that typically occurs with a strengthening economy. But a strengthening economy should result in higher treasury yields. Unfortunately, we haven't seen that as the 10 year treasury yield ($TNX) stubbornly refuses to budge higher. The loser in all of this? Banks ($DJUSBK). The squeezing yield spread between the 10 year treasury yield and 2 year treasury yield ($UST10Y-$UST2Y) puts pressure on interest margins and profits at banks. The following chart illustrates the lowering spread over the past year and its effect on the performance of bank stocks:
 While the DJUSBK has been in a nice recovery in 2019, its relative strength vs. the benchmark S&P 500 has been drifting lower since the relative high was reached in January 2019.
Sector/Industry Watch
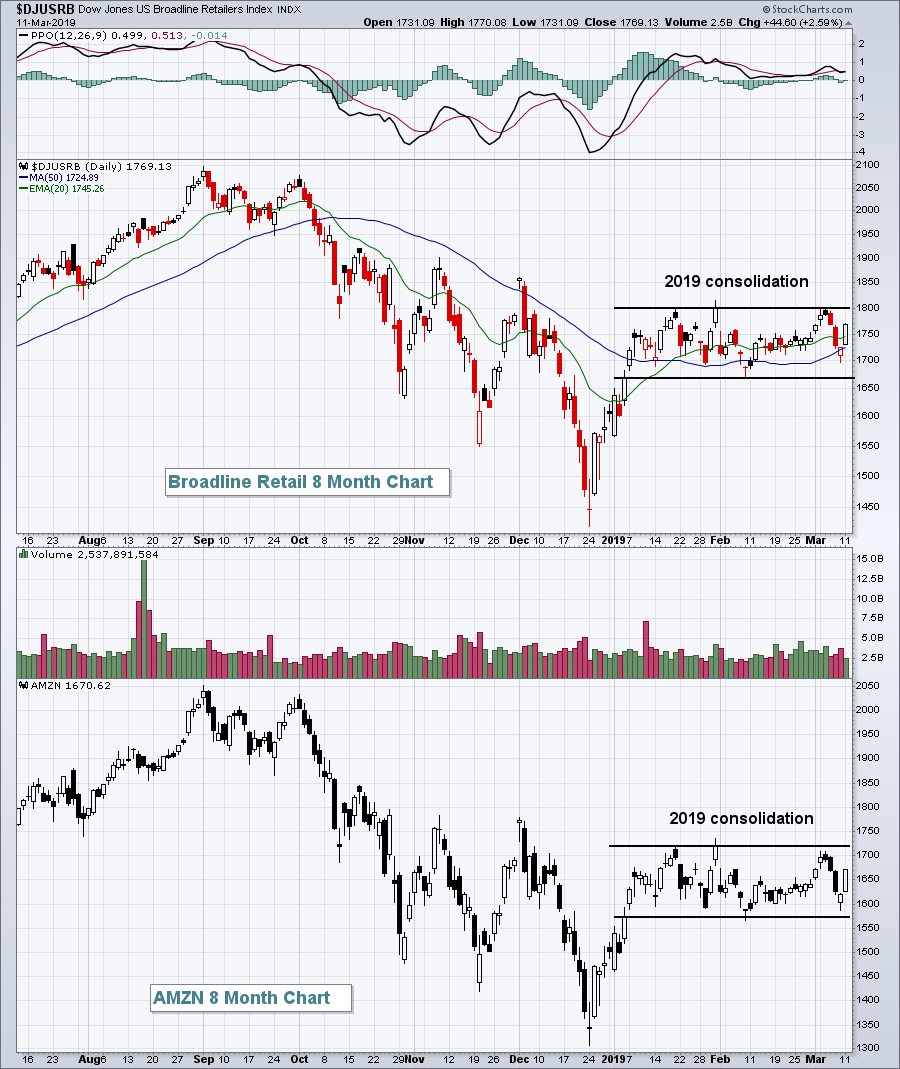
Amazon.com (AMZN) has been struggling in 2019, resulting in weakness in broadline retailers ($DJUSRB). But the group, and AMZN, both had stellar days on Monday, helping to lead our major indices higher:
 2019 consolidation is evident, however. While many other sectors, industry groups, stocks, etc., are rising and holding rising 20 day EMA support along the way, both the DJUSRB and AMZN continue to trade back and forth, above and below their respective 20 day EMAs. That's the definition of a flat, trendless chart. Until they both break out above their current ranges, they're dead money.
Historical Tendencies
Yesterday, I discussed the historical bullishness this week for the S&P 500. It's bullish for the NASDAQ and Russell 2000 as well. Below are the annualized returns for each for the period March 11th through March 18th:
NASDAQ (since 1971): +25.58%
Russell 2000 (since 1987): +43.31%
Key Earnings Reports
(actual vs. estimate)
DKS: 1.07 vs 1.07
Key Economic Reports
February CPI released at 8:30am EST: +0.2% (actual) vs. +0.2% (estimate)
February Core CPI released at 8:30am EST: +0.1% (actual) vs. +0.2% (estimate)
Happy trading!
Tom
