Market Recap for Thursday, March 14, 2019
Thursday was a day of rest and bifurcated action. The Dow Jones gained ground, albeit a rather miniscule 7 points, but the other major indices fell. The Russell 2000, NASDAQ and S&P 500 dropped 0.40%, 0.16%, and 0.09%, respectively, as materials (XLB, -0.75%) struggled with a rallying dollar ($USD, +0.31%). Energy (XLE, +0.11%) didn't suffer the same dollar-related fate, however, as crude oil prices ($WTIC, +0.60%) rose for a fourth consecutive day and ended with its highest close since mid-November.
Specialty finance ($DJUSSP, +0.86%) and insurance brokers ($DJUSIB, +0.74%) led a strong financial group (XLF, +0.38%) as both groups have been excellent relative performers and continued to show leadership on Thursday:
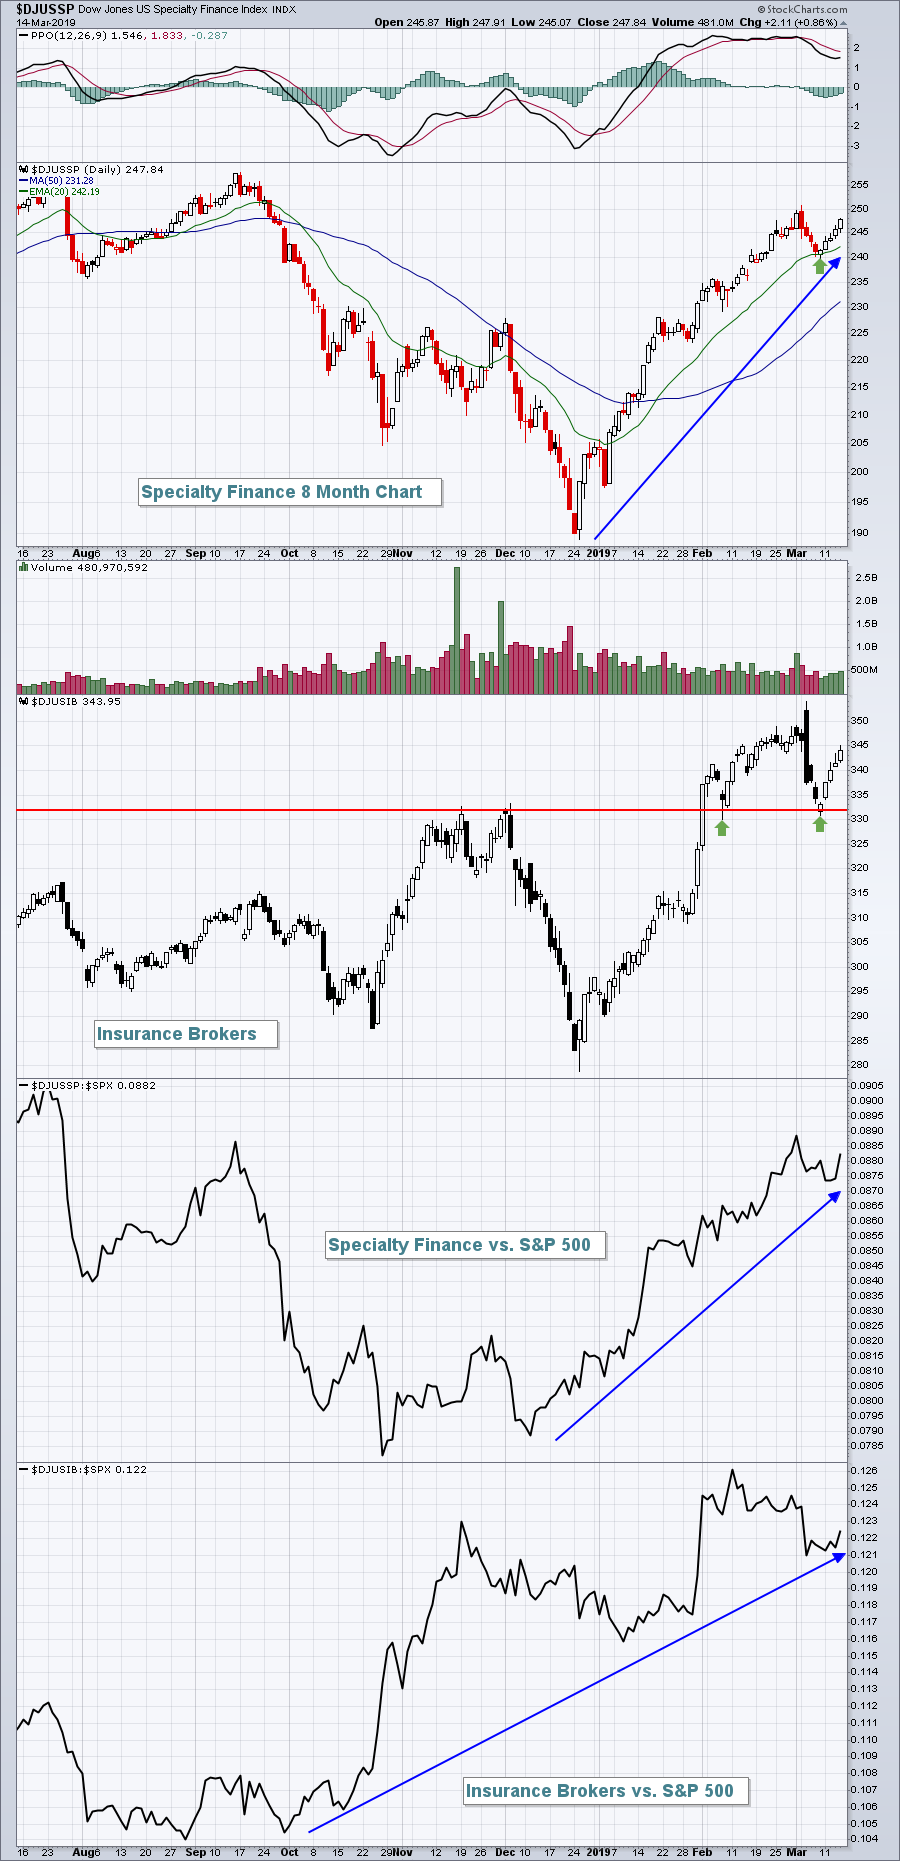 These two groups are not only performing well on an absolute basis, but they're also outperforming the benchmark S&P 500 on a relative basis, despite belonging to a sector (financials) that is lagging on a relative basis. That's leadership. If the 10 year treasury yield ($TNX) ever begins to strengthen, financials should do well with further strength coming from specialty finance and insurance brokers.
Industrials (XLI, -0.33%), like materials, lagged on Thursday as defense stocks ($DJUSDN, -1.20%) struggled after failing to clear their 20 day EMA.
Pre-Market Action
The 10 year treasury yield is down another 2 basis points this morning, just above the 2.60% yield support level. Crude oil ($WTIC) is seeing a bit of profit taking, down approximately 0.75% at last check.
Asian markets were higher overnight and European markets are up modestly this morning. Dow Jones futures are up by roughly 100 points with 30 minutes left to the opening bell.
Current Outlook
It's always a good idea to check in on transports ($TRAN) as a gauge of our economy. We saw a recent selloff that dropped the TRAN below its 20 day EMA, but we also saw a reversal off of a 50 day SMA test. The TRAN has moved back above its 20 day EMA and is poised now to challenge overhead price resistance:
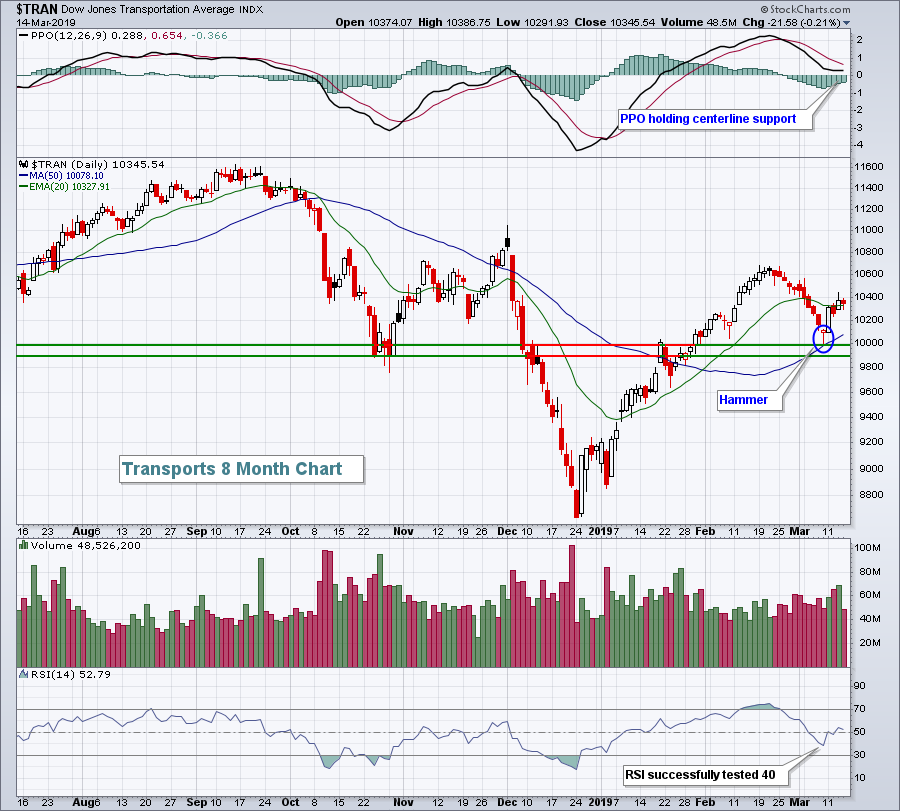 Transports, like financials (discussed below), have lagged in terms of relative strength, but do continue to trade in bullish fashion. I wouldn't be worried looking at the TRAN chart unless we were to lose the 9900-10000 price support area illustrated above.
Sector/Industry Watch
Financials (XLF) have been laggards throughout this 2 1/2 month rally as treasury yields have remained low. Rising yields favor financials, especially banks ($DJUSBK) and life insurance ($DJUSIL), but this rally has been unusual in that money hasn't rotated away from defensive treasuries. The absolute performance has been fine, but relative performance is weak and likely will be until yields begin to turn higher:
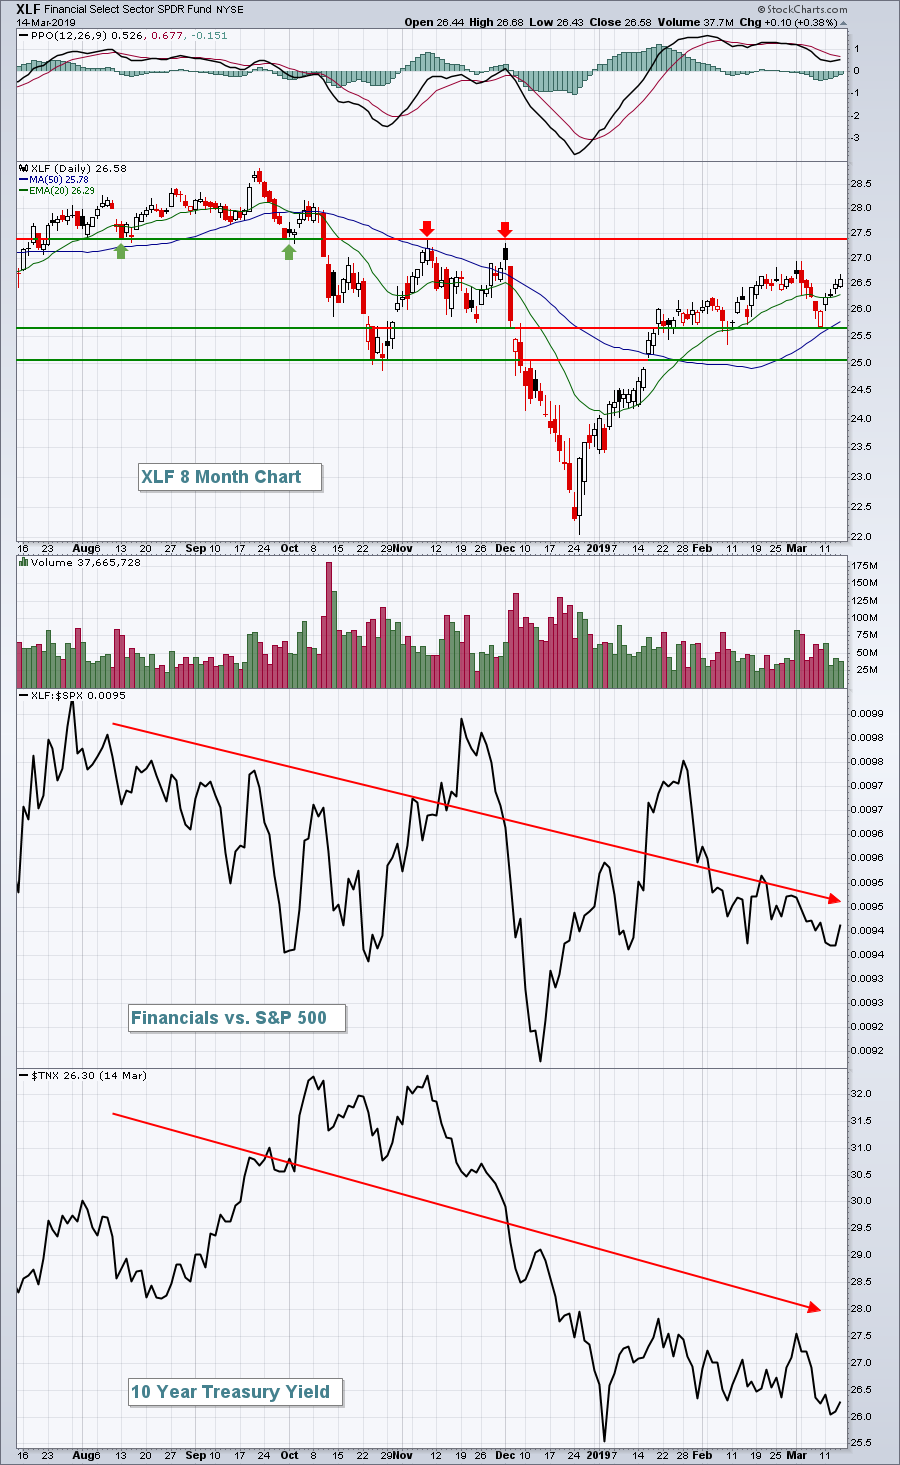 The XLF shows a rising 20 day EMA and 50 day SMA and price is above both. So the absolute chart remains healthy, but the relative strength has been weak. That will turn with rising yields.
Historical Tendencies
Fridays have been a very bullish day of the calendar week, producing annualized returns of 17.32% on the S&P 500 since 1950. That's nearly double the average S&P 500 annual return of 9% over the same period.
Key Earnings Reports
None
Key Economic Reports
March empire state manufacturing survey released at 8:30am EST: 3.7 (actual) vs. 10.0 (estimate)
February industrial production to be released at 9:15am EST: +0.4% (estimate)
February capacity utilization to be released at 9:15am EST: 78.5 (estimate)
March consumer sentiment to be released at 10:00am EST: 95.2 (estimate)
Happy trading!
Tom
