Market Recap for Monday, June 24, 2019
The U.S. stock market waffled yesterday as the G-20 summit set to begin later this week. We know from history that any time the headlines are littered with US-China trade, we need to be vigilant. While there wasn't widespread selling yesterday, equities weren't able to build upon recent all-time highs either. The Dow Jones was the lone index to end Monday's session with gains as that index of conglomerates managed to eke out an 8 point gain. Meanwhile, the small cap Russell 2000 ($RUT, -1.26%) lagged badly once again. The loss moved the RUT back beneath all of its key moving averages as it seeks direction:
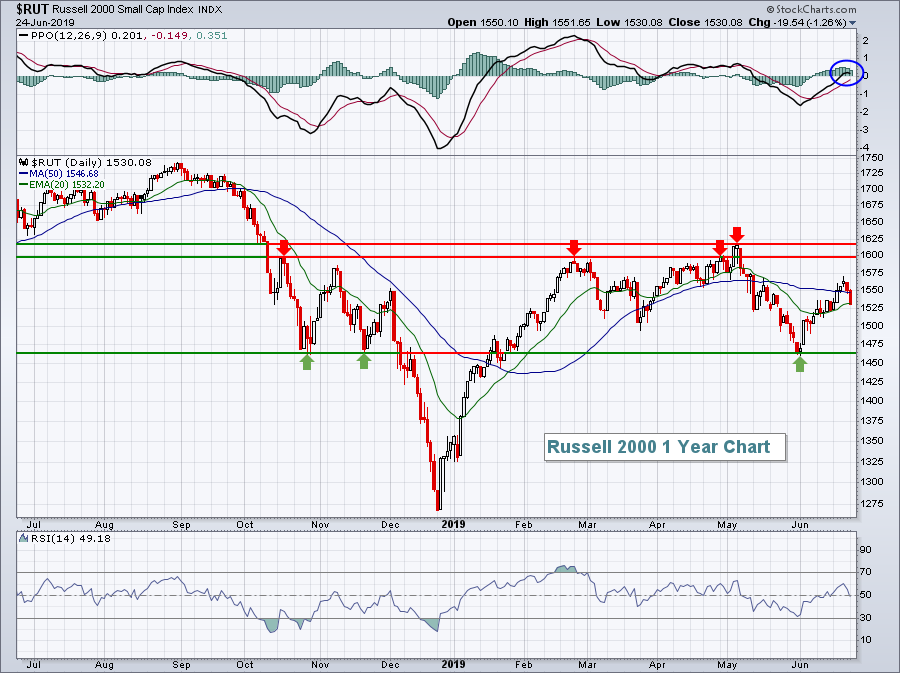 The PPO residing almost squarely on its centerline tells us that the RUT is directionless at the moment and the price support/resistance levels clearly mark the 2019 boundaries. We are in the middle of that wide trading range, but monitoring which direction the RUT breaks will be critical.
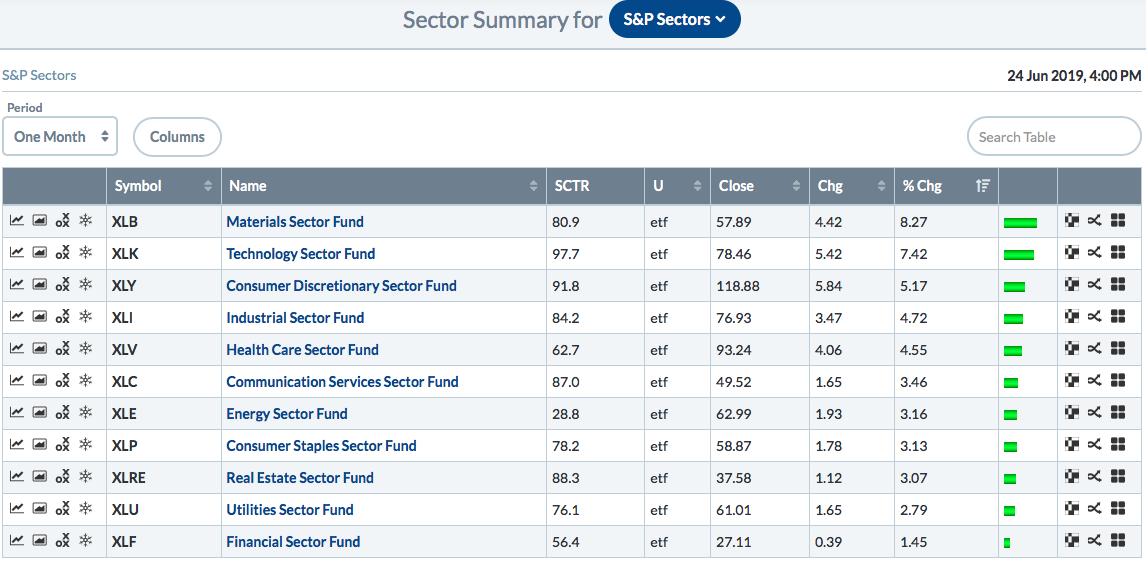
Materials (XLB, +0.38%) continued in its leadership role as the U.S. Dollar ($USD, -0.24%) fell for the 4th day in a row. It's been a rough month for the USD and we're likely to see further weakness in the near-term as I pointed out in my ChartWatchers article last weekend titled, "The Bullish Case For Gold Isn't All That Strong". A weak dollar typically signals absolute and relative strength in commodities and that's exactly what we're seeing with the XLB. I don't believe the long-term outlook for materials is bullish - at least based on what I'm seeing right now, but that could change. It all depends on the longevity of the dollar's issues.
Pre-Market Action
The 10 year treasury yield ($TNX) is down another basis point this morning to 2.01% as it nears a second attempt to break below the psychological 2.00% level. The Fed's stance of turning move dovish is not only pressuring treasury yields, but it's also been playing havoc with the U.S. Dollar ($USD), which has fallen significantly this month. That, in turn, has been helping materials (XLB) to outperform the benchmark S&P 500 handily over the last month:
 Meanwhile, gold ($GOLD) is up another $10 this morning to $1428 per ounce.
Asian markets were weak overnight, especially in Hong Kong with the Hang Seng Index ($HSI) down more than 1%. European markets are mostly hugging the flat line this morning and U.S. futures are down slightly with Dow Jones futures lower by 5 points with 30 minutes left to the opening bell.
Current Outlook
I am watching the relative strength of the Russell 2000 vs. the S&P 500 ($RUT:$SPX) closely. We've reached a 10 year relative low and we're not far from a 15 year relative low. This is an area where I'd expect to see relative strength in small caps, but it just isn't happening yet:
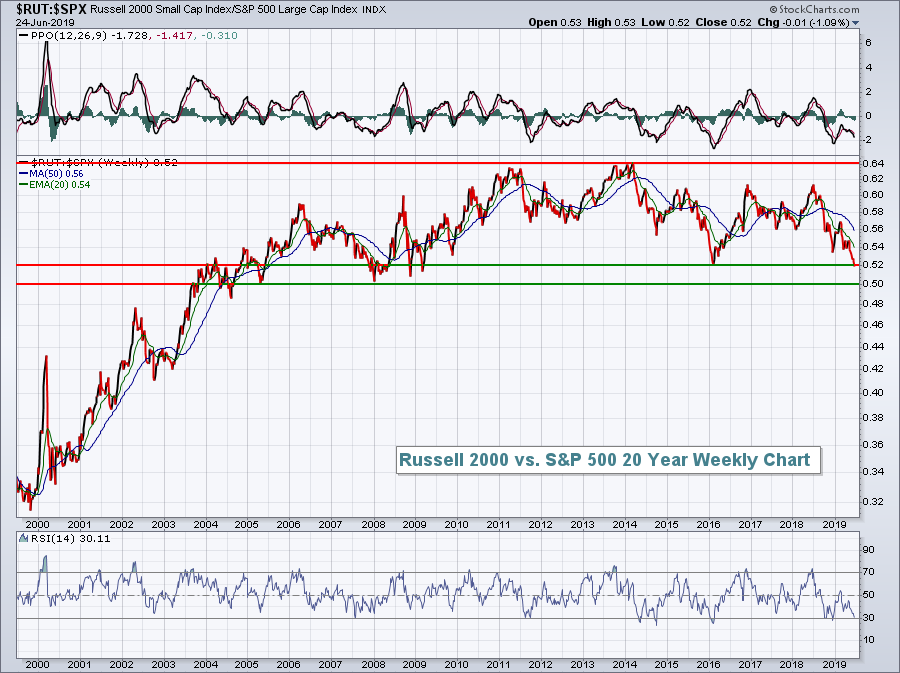 It's difficult to say when this ratio will turn higher, but technical analysis suggests we're at or approaching major long-term pivot points.
Sector/Industry Watch
The Dow Jones U.S. Toys Index ($DJUSTY, +2.14%) had a very solid Monday and just closed at its highest level since November 29, 2018:
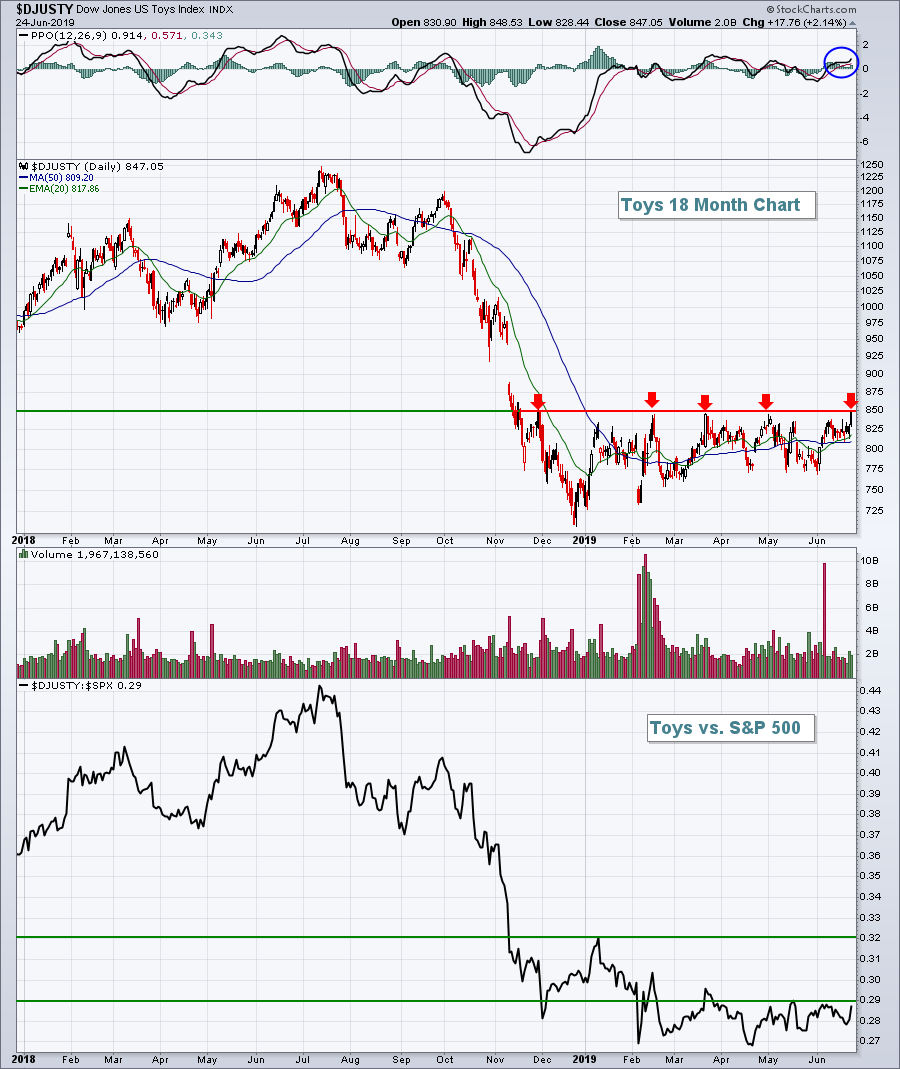 The relative strength ($DJUSTY:$SPX) hasn't really improved all that much, but there is a relative bottom in play from April. If we could clear the 850 level on an absolute basis and clear the May relative high near 0.29, that would be a good start to repairing all the technical damage inflicted during the massive Q4 absolute and relative selloff. If I bought a toy stock at this level, I'd make sure I exited if the relative strength in the DJUSTY turned lower again.
Historical Tendencies
Baidu, Inc. (BIDU) has been in a very steep downtrend and has been a horrible absolute and relative performer. Since topping in May 2018, its shares have fallen from over 280 to Monday's close just beneath 117. There's one ray of hope despite the weak technical outlook. BIDU has a history of performing very well during the bearish July through September summer period. Here's a recap:
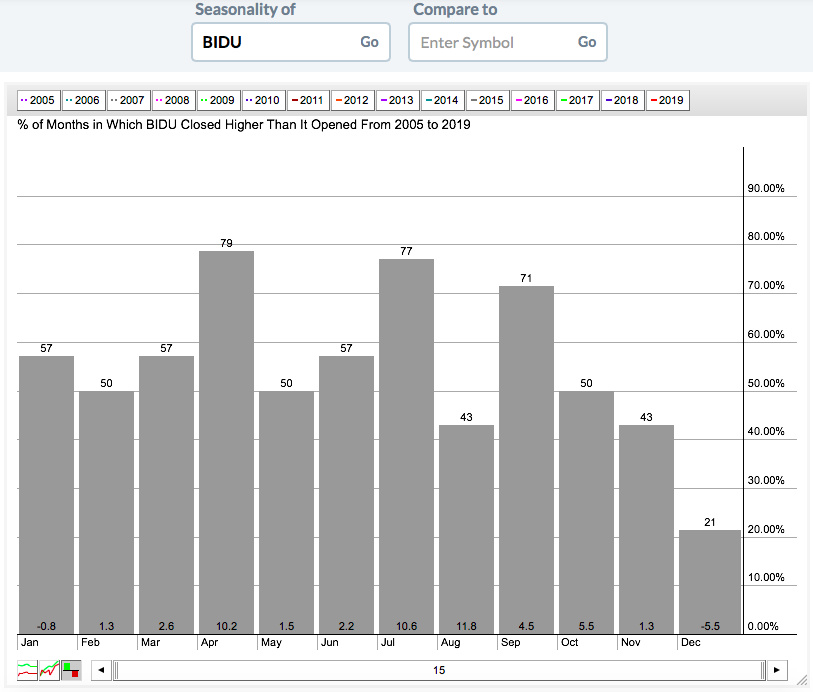 There are many technical hurdles that remain, but BIDU averaging gaining 26.9% from July through September over the past 15 years might be enough to get the stock rolling. We'll see.
Key Earnings Reports
(actual vs. estimate):
FDS: 2.62 vs 2.37
LEN: 1.30 vs 1.13
(reports after close, estimate provided):
AVAV: .25
FDX: 4.81
MU: .78
SNX: 2.71
Key Economic Reports
April Case-Shiller HPI to be released at 9:00am EST: +0.2% (estimate)
April FHFA house price index to be released at 9:00am EST: +0.2% (estimate)
May new home sales to be released at 10:00am EST: 680,000 (estimate)
June consumer confidence to be released at 10:00am EST: 132.0 (estimate)
Happy trading!
Tom
