Market Recap for Friday, June 21, 2019
The S&P 500 ended Friday's session relatively flat, but had a very solid week as it raced to an all-time high before sellers hit on quad-witching day. As usual, quad-witching day volume was extremely heavy. I wouldn't read too much into that. Given the strength of the daily PPO, I believe either the S&P 500 will continue pushing higher this week....or potentially test its rising 20 day EMA if sellers decide we've seen too much in this rally. However, keep in mind that the stock market has a strong tendency to move higher the 2-3 weeks prior to the kickoff of earnings season as traders anticipate better-than-expected earnings.
Energy (XLE, +0.72%) provided leadership on Friday as crude oil prices ($WTIC, +0.63%) jumped to their highest level in nearly a month. It was a very good week for crude and the XLE. Leadership also continued to emerge from healthcare (XLV, +0.48%). Health care providers ($DJUSHP, +1.34%) remain in a steady uptrend since bottoming on very heavy volume in mid-April:
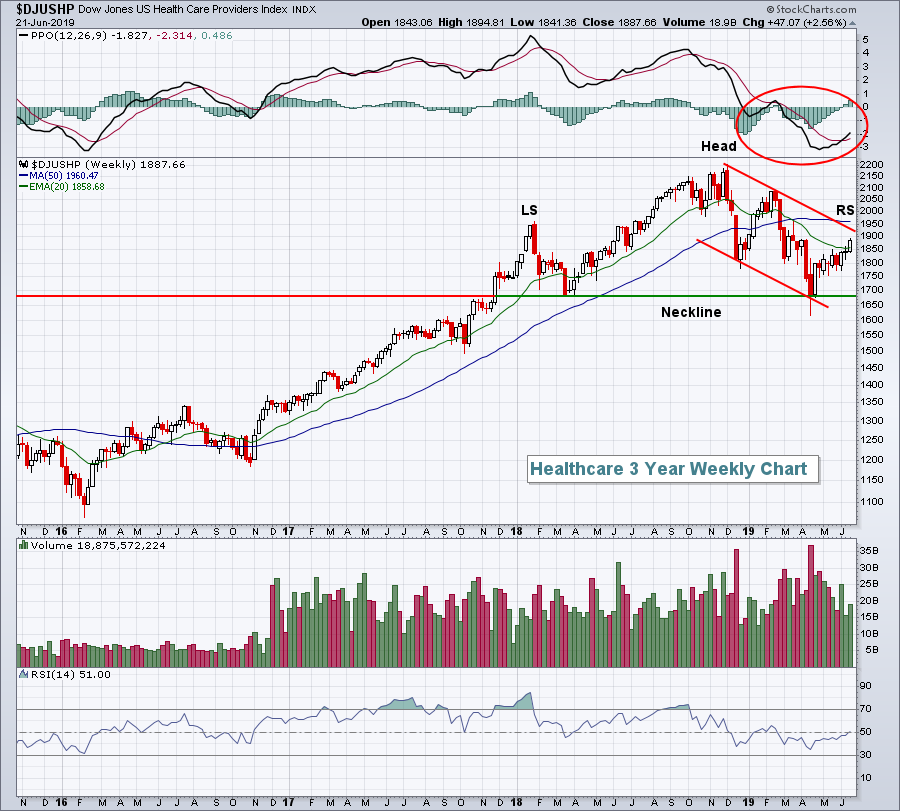 The short-term uptrend is nice, but we can't lose sight of the bigger picture head & shoulders pattern. I'm bullish longer-term so I don't see this pattern breaking to the downside. Remember, these patterns do not confirm until a breakdown occurs. But it's still wise to at least acknowledge the possibility of a longer-term top. Note that the down channel established in December 2018 shows a current intersecting high near 1925. The 50 week SMA is at 1960 and the left shoulder formed near 1950. This range is very important technically. A break above all three would suggest we won't see a head & shoulders breakdown.
Pre-Market Action
The 10 year treasury yield ($TNX) is down 3 basis points to 2.04% and gold ($GOLD) is up another $9 to $1409 per ounce, another multi-year high. Crude oil ($WTIC) is up just under 1% this morning and approaching $58 per barrel.
Asian markets were fractionally higher overnight, while equities in Europe are mixed. Dow Jones futures are higher by 66 points as we're 30 minutes from beginning a new trading week.
UBS is out this morning with a report that the entire globe is heading for a recession if US-China trade talks fail this morning. Drama much? The S&P 500 hit an all-time high on Friday and is one of the best leading economic indicators. Why do people try to call tops every week? Oh.....and Peter Schiff, Mr. Perma Bear, was out squawking over the weekend that gold ($GOLD) is heading for $5000 in the next two years. He has a history of making the boldest (and dumbest to be quite honest) calls. He's a fear mongering fool in my opinion. He said the initial rally on the S&P 500 in 2011 was the final straw before financial armageddon. Media outlets that give him a microphone should be banished.
Current Outlook
The Dow Jones U.S. Railroads Index ($DJUSRR) is consolidating its huge gains from earlier in 2019 and that's not a bad thing. It remains in a short-term down channel, but the overall longer-term action here has been quite constructive:
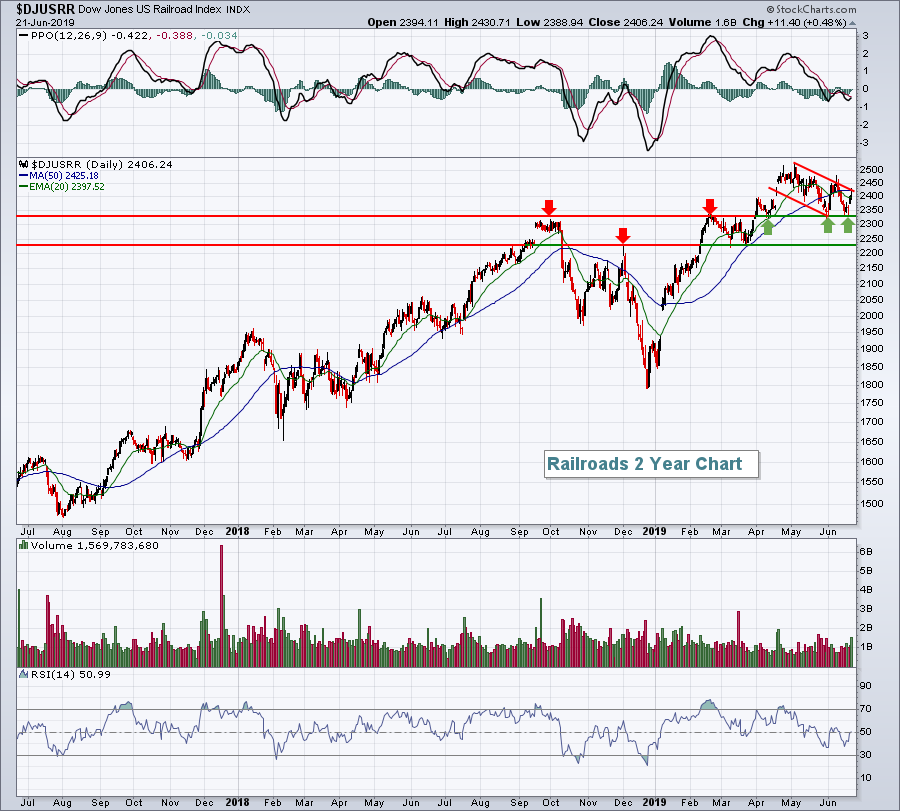 There's strong short-term support at the 2330 level. While that isn't a "must-hold" support level, it is a level where we've seen buyers step in the past three months.
A resumption of the uptrend in a leading industry group is generally a very bullish development for equities. It's a signal I'll be watching closely in the 2nd half of 2019.
Sector/Industry Watch
Healthcare (XLV, +0.48%) has been a leader among its sector peers, gaining more than 5% over the past month and ranking only behind materials (XLB) during that span. Technically, the sector is approaching a major breakout as well:
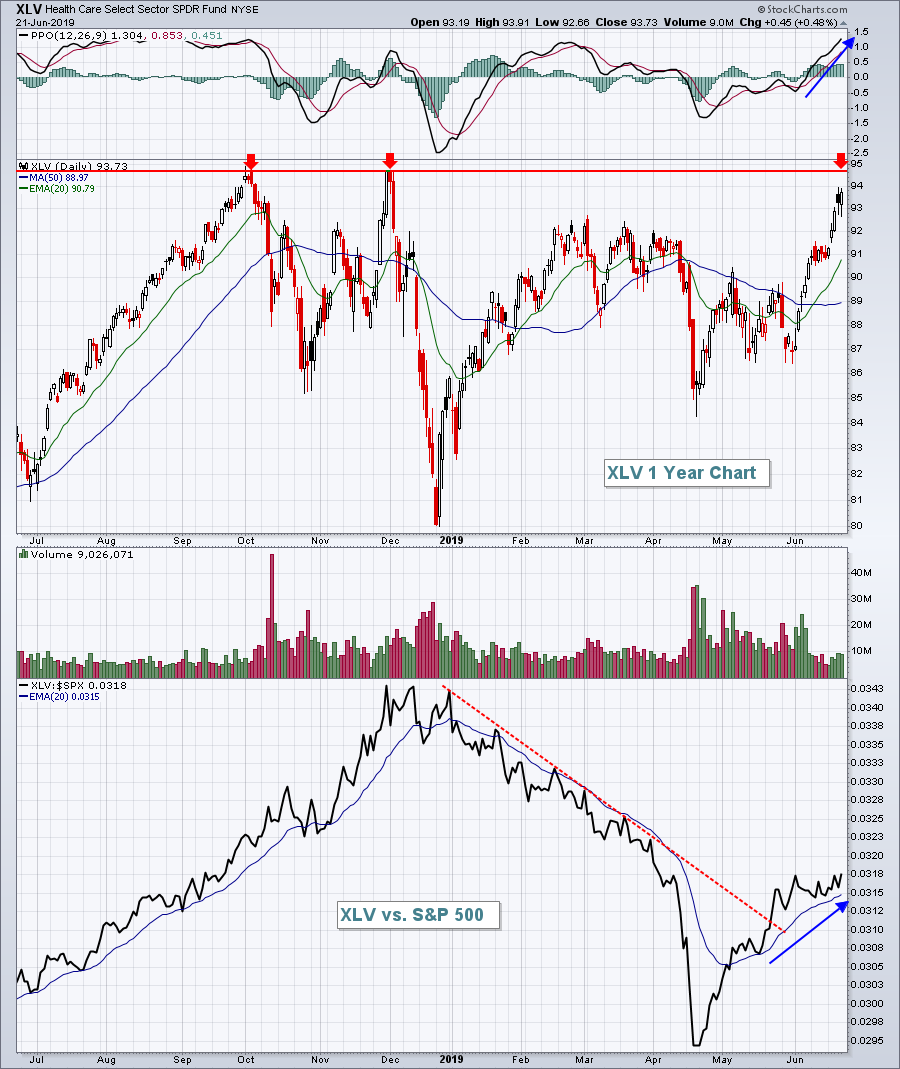 The XLV:SPX relative strength line has been soaring for the past two months and has been holding its rising 20 day EMA. That's a very good sign. A breakout above key price resistance just below 95 would be quite bullish given the relative strength backdrop.
Monday Setups
Cadence Design Systems (CDNS) has been a market leader for quite some time and recently forged to yet another high. The pullback on Friday is likely an entry opportunity:
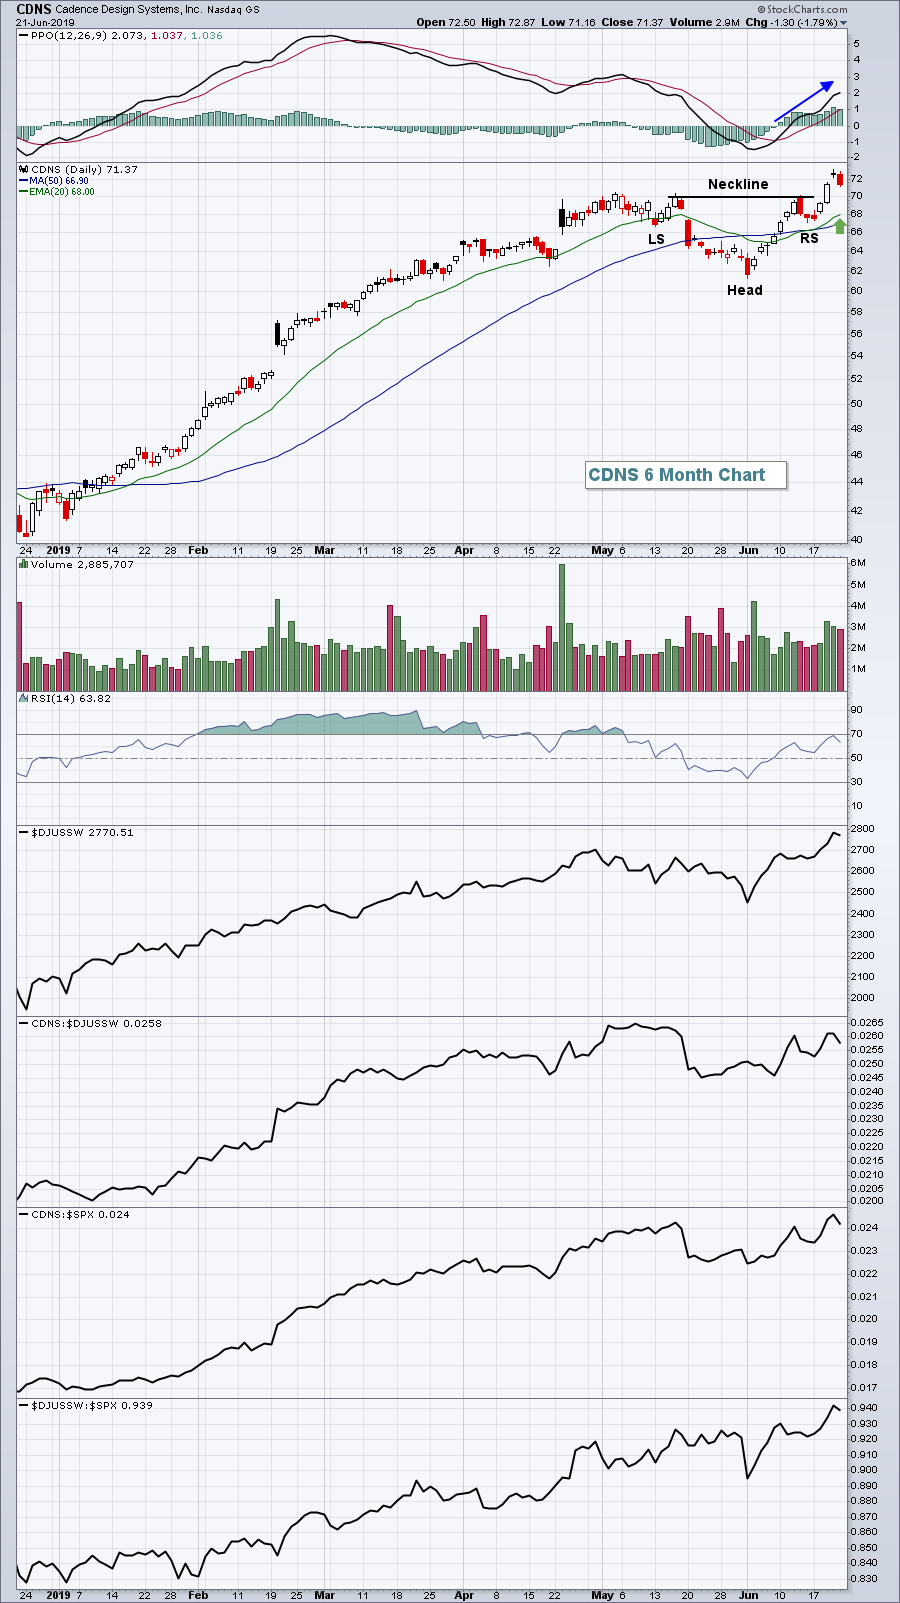 CDNS broke out of a bullish inverse head & shoulders pattern that now measures to 78 and I believe we'll get there. It's part of a very strong software group and it's one of the leaders. I'd be a buyer down to the rising 20 day EMA and consider the 50 day SMA as a closing stop level.
Historical Tendencies
Sealed Air Corp (SEE) is the type of stock where I'd keep my stop very tight. It's been in an uptrend throughout 2019, but its relative strength vs. its peers has broken to its lowest level in five months and the June through September period has proven to be very difficult historically. First, the technical outlook:
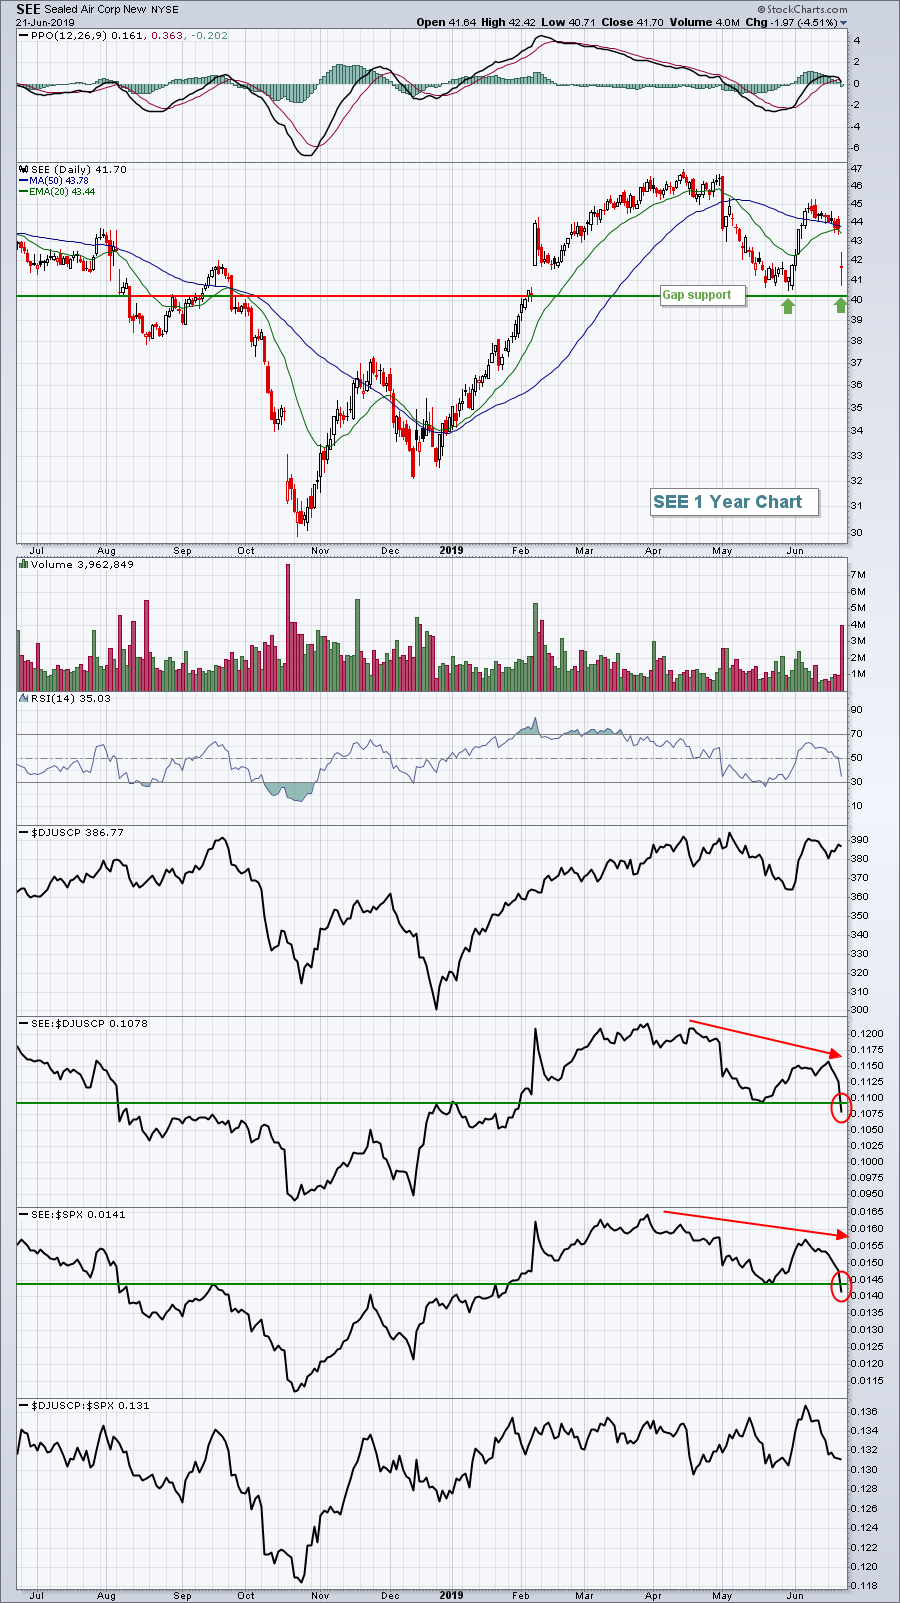 Those relative breakdowns are quite apparent and so is the bearish seasonal pattern:
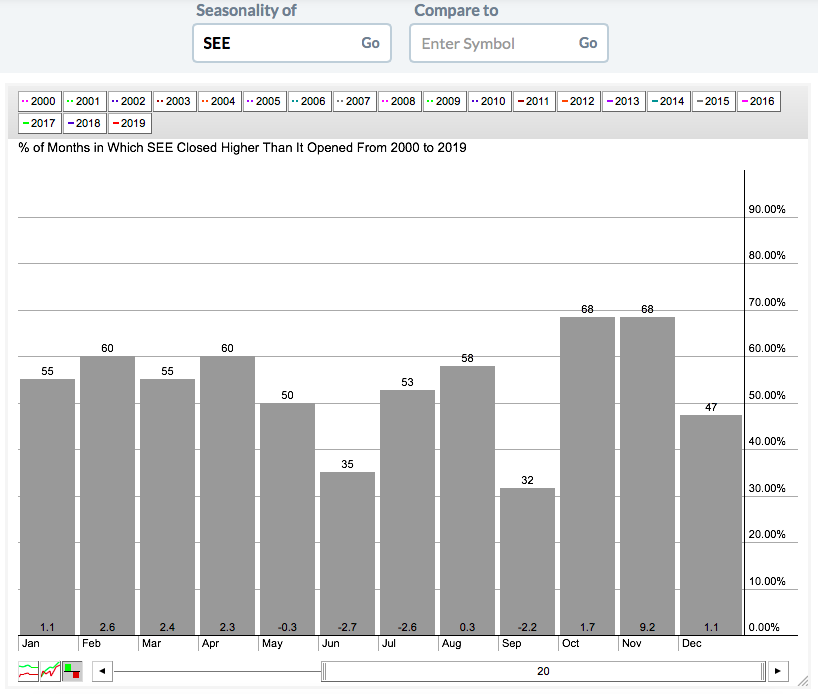 The average return for SEE from June through September is -7.2% over the past 20 years. Combining that with the relative strength breakdowns in the stock is a significant warning sign.
Key Earnings Reports
None
Key Economic Reports
None
Happy trading!
Tom
