The market erased the gains that we highlighted in our previous newsletter in one day as the 10,600 level on the Dow proved once again that it is an important level for the market. This week's big news of course was the Fed's rate hike. How will it affect the charts? Let's see what our commentators think...
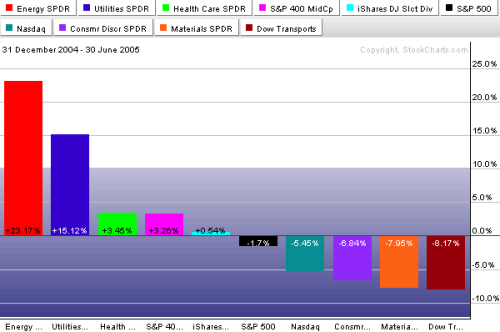
The bars in the following chart show the best and worst group performers for the first half of the year. To no one's surprise, energy was the top sector -- while the fuel-sensitive transports were the weakest. Utilities took second place thanks to falling bond yields. Another defensive group -- healthcare -- did relatively well. Midcaps did better than small and large caps. Dividend paying stocks also held up ok (as did large cap value stocks). Among the first half's weakest groups were basic materials (which include cyclical stocks), consumer discretionary , and the technology-dominated Nasdaq . The relative strength bars paint a picture of a defensive market that's being hurt by rising energy prices. If the second half of the year is going to be any better, the first half laggards are going to have to do better. And it's hard to imagine a strong market as long as energy remains in a leadership position.
It wasn't a good first half, but it wasn't terrible either. All the major stock indexes ended in the red but not by much. The S&P 500 lost -1.7%, the Dow -4.7%, and the Nasdaq -5.4%. Bonds gained more than 5% to outpace stocks. The dollar gained 10% while commodities gained a respectable 5%. The rising dollar made U.S. assets preferable to foreign assets during the first six months of the year. Of course, it's easy to spot winners in hindsight. And there's no guarantee that the first half trends will continue. One important lesson from the first half results, however, is that there are always winning groups -- even in a weak market. Our job in the next six months will be to pick second half winners and avoid losers -- no matter which direction the market takes.
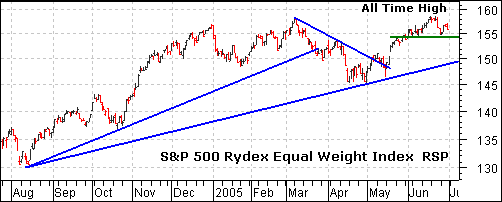
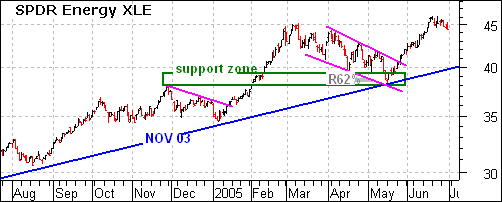
The Rydex Equal Weight S&P 500 Index (RSP) moved to a new all time high last week. Strangely enough, the Energy SPDR (XLE) moved to a new all time high two weeks ago. It is clear that Energy stocks have the best of both worlds: rising demand and rising prices. When will it end?
If you consider the stock market a leading indicator, then the economy must be in pretty good shape and demand for oil is robust. Should the stock market fall sharply, it would suggest an economic slow down and this would affect the demand for oil. It stands to reason that the Energy sector will remain strong as long as the broader market holds up.
The correlation between XLE and RSP has been quite strong since August. RSP advanced from August to December and XLE advanced from August to November. The Energy SPDR (XLE) had an extra leg up in January-February and then both corrected in March and April. RSP bottomed at the end of April and XLE soon followed with a bottom in May. It stands to reason that Energy will remain strong as long as the broader market (economy) holds up.
A good measure of market participation -- the number of stocks participating in upside price moves -- is the percentage of stocks above their 200-day moving average. DecisionPoint.com tracks this number on the major market indexes, and in this instance we are looking at this indicator for the S&P 600 Small-Cap Index.
Note how the indicator has been making lower highs for the last 18 months, even as the price index has made new all-time highs. This negative divergence is not necessarily fatal, but it does reflect how the price index is being supported by fewer and fewer stocks.
The price index can move higher because it is capitalization-weighted. This allows the larger-cap stocks in the index to carry it higher, while increasing numbers of smaller-cap stocks begin to fade. This is not healthy, and it is another piece of evidence that indicates that the cyclical bull market is probably near an end.
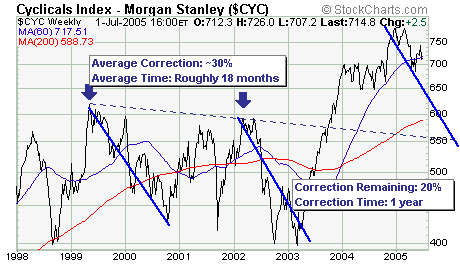
The MS Cyclical Index ($CYC) is quite interest rate sensitive; and thus prone to large corrections witness the past 7 year history of which there are two very distinct 30% corrections. Hence, given short-term rates are rising, we believe that the index is in the midst of another such correction that over the next year will carry the index lower by over 20%. A top has formed, and thus rallies should be sold or sold shortwhile dips should not be bought.