Having cracked the 10,600 resistance level, the Dow immediately ran into problems at 10,700 and then Friday's session ended in a disappointing close back below 10,600. Volume has remained relatively light. All in all, a picture of a directionless market during the summer doldrums. But let's see what our other commentators think...
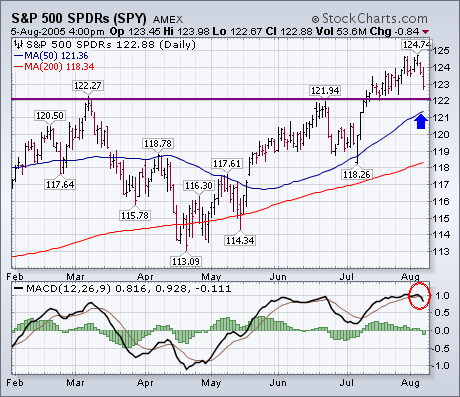
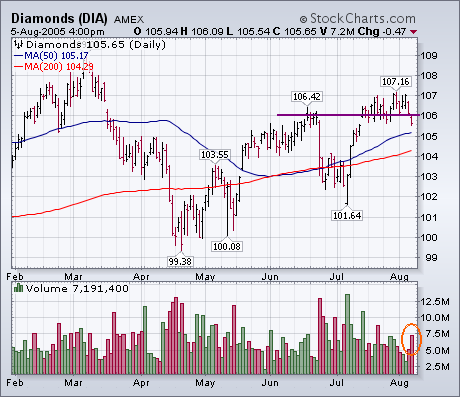
The market's short-term picture continues to weaken. Yesterday I wrote about the MACD lines for the S&P 500 being on the verge of turning negative. They did that today for the S&P and several other major market averages. That signals the start of a short- to intermediate-term correction. For the S&P 500 SPDRs (Chart 1), the first significant test of support will come around the 122 level. Two peaks were formed around that level (March and June) prior to July's upside breakout. On pullbacks, an index is supposed to find support along old breakout points. Another potential support level is the rising 50-day moving average. The market's overbought condition, combined with the fact that August is usually a weak month, is enough to raise the market's risk level for the balance of the summer. Chart 2 shows the Dow Diamonds falling back below their June high at 105 on rising volume. That's another caution flag.
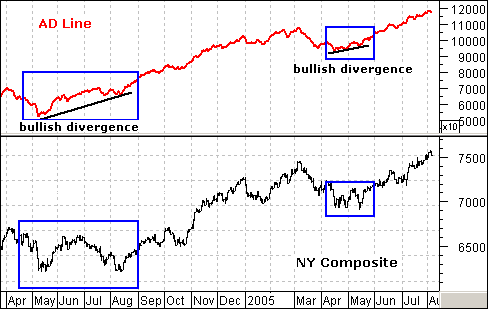
Bullish and bearish divergences in the AD Line often precede significant bottoms and tops. Even though reversals are certainly possible when the AD Line is keeping pace, they are the exception rather than the rule. (Note: The Advance Decline Line is a cumulative measure of advancing issues less declining issues).
As the chart above shows, a large bullish divergence preceded the August low as the NYSE Composite formed an equal low and the AD Line formed a sharply higher low. In addition, a smaller bullish divergence formed in April and May. This foreshadowed the May low and led to a strong advance over the last few months.
The AD Line has been keeping pace with the index since May and shows no signs of divergence (weakness). Both the NYSE Composite and the AD Line recorded new highs this week. Strength in the AD Line reflects broad participation. The bull market may seem old and tired, but there is no evidence of weakness or lack of participation in the AD Line.
Generally speaking, gold and the dollar have an inverse relationship -- a rising dollar causes the price of gold to decline and vice versa; however, supply and demand pressures also influence the price of gold, but it is often difficult to see them. For this we use the GolDollar Index.
The GolDollar Index was invented buy Tom McClellan (www.mcoscillator.com), and is calculated by multiplying the price of gold by the U.S. Dollar Index. (We divide the result by 10 to keep the numbers from getting too big.) Its purpose is to cancel the effects of currency fluctuations on the price of gold. By comparing it with the spot gold index we can determine if there is inherent strength/weakness in the price of gold.
The first panel on our chart shows that the GolDollar Index has been rallying since the beginning of the year and has exceeded its 2004 high. This means that the demand for gold has been strong enough to overcome the negative effects of the dollar's strength. This is also evident from the fact that, rather than declining, gold has been consolidating in a triangle formation, even though the dollar has been rallying.
Now the dollar has begun a correction (see bottom panel of chart), so it is likely that gold will be breaking out of the triangle and challenging the 2004 high around 450. Assuming that (1) gold's intrinsic strength persists, and (2) the dollar continues to correct to its support around 85, gold could rally above the 450 level by 10 or 20 dollars.
Unfortunately, such a move will likely prove to be a gold bull trap. The weight of the technical evidence indicates that the dollar has begin a long-term rising trend, which is long-term bearish for gold. But for now, the dollar is showing short-term weakness, and gold has intrinsic strength -- a combination that should make gold bugs very happy . . . for a while.