Wow! Six years into the new millennium already - and into StockCharts.com's seventh year of existence! Last year was our strongest year ever as we continued to expand our site and our subscribership. This year looks even brighter with the upcoming release of SharpCharts2 and our long-awaited streaming chart tool.
Speaking of which, the final Beta release of SharpCharts2 - Beta 7 - will be out on February 1st. With greatly expanded control over overlays and colors, as well as the ability for members to store charts into their accounts, SharpCharts 2 Beta 7 will be another major milestone in our quest to provide the very best charts on the Internet.
Meanwhile, the markets have remained busy, in part because of the current state of the Yield Curve. Depending on who you talk to, the Yield Curve is either inverted or very close to it. In lieu of those developments, we recently updated our Dynamic Yield Curve tool to include several additional bond yield datasets. Here's a snapshot of the new version which shows the additional data and the flat/inverted state of affairs:
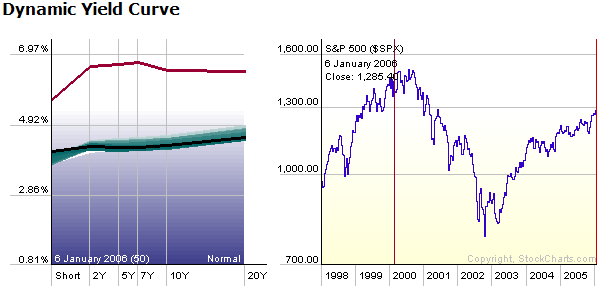
The black line is the current yield curve. The blue-green "trails" behind it show what it has looked like during the previous 50 trading days. Notice that the middle of the yield curve is very flat (possibly dipping slightly)? That is the possible inversion that people are talking about.
Why is that so important? Check out the red line at the top of the chart. That is what the yield curve looked like back in early 2000 - the last time the yield curve inverted. Notice that the yield curve inverted just before the market peaked (see the red vertical line on the S&P chart?). So, is the yield curve now signaling another market downturn? That's what everyone is concerned about.
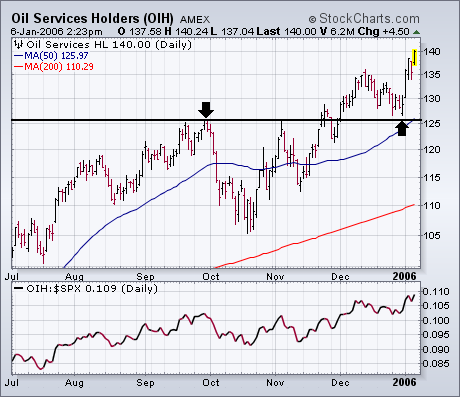
The market is starting the new year with a bang. Virtually all of the major market averages have risen to new 52-week highs. Some of that new optimism is the result of the Fed minutes released earlier in the week hinting that it might be close to ending its rate-hiking. I've expressed skepticism about the staying power of the early 2006 strength. But only time will tell if that skepticism is warranted. I've also suggested that January is traditionally the best month of the year to take some money out of the market is one is so inclined to do so. An alternative to taking money out of the market is rotating it to those market groups that are leading the market higher. It should come as no surprise that some of those early leaders are commodity-related stocks (especially gold) and foreign stocks. I've been writing about that trend for several months. I suggested earlier in the week that those same Fed minutes that sparked this week's market rally also weakened the dollar. If anything, the falling dollar has accelerated the move into commodity-related stocks and foreign markets this week. Hopefully, our readers are already aboard those moves. Energy stocks are also among early 2006 leaders as oil has climbed back over $64. Oil service stocks are the clear leaders there. Chart 1 shows the Oil Service Holders (OIH) hitting a new record on Friday. The recent pullback stopped just above its 50-day average and chart support along its late September high. That's a textbook example of what an uptrend should do. Its relative strength line is also in new high ground. Chart 2 shows the Energy Sector SPDR (XLE) nearing a challenge of its September high. It too is starting to outperform the S&P 500 again. While that may help boost the S&P over the short run, continued energy leadership is usually bad for the S&P further out in time. Early 2006 leadership is also coming from chip and internet stocks.

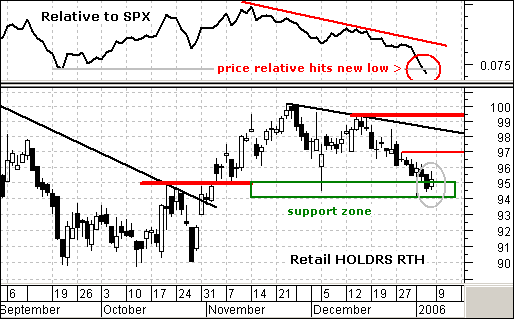
Despite a strong start in the S&P 500 this year, the Retail HOLDRS (RTH) remains under pressure and is lagging the overall market. This is not a good sign for the industry group or the Consumer Discretionary sector, which is heavily weighted towards retail stocks. In addition, retail sales drive 2/3 of GDP and weakness in this group is not a good sign for the economy.
The Retail HOLDRS (RTH) is trading near broken resistance, but shows no signs of strength and weak relative strength argues for continued underperformance. On the price chart, the Retail HOLDRS (RTH) broke resistance (95) in November with an advance to 100. Weakness in December and January drove the stock back to broken resistance at 95 and this area now acts as support (green rectangle).
RTH made two attempts to firm this week, but more is needed to revive the bulls in this key group. With a black candlestick on Thursday and smaller white candlestick on Friday, a harami formed at support (gray oval). These are bullish candlestick reversals that require confirmation. I would look for a move above 97 for initial confirmation and this would target a resistance test around 100. A break above 100 would be most bullish for the group, the Consumer Discretionary sector and the broader market.
I am often asked to make an annual forecast, and I frequently oblige, but this year I'd like to take a different approach. Rather than making a "forecast," let's make an assessment of some significant factors that will be affecting market progress in 2006.
First is the 4-Year Cycle. On the S&P 500 chart below I have drawn vertical lines through the actual 4-Year Cycle troughs, as well as a few places where price troughs should have occurred but didn't. For the most part we can say that significant price lows occur every four years about 85% of the time.
Take note that the log scale causes recent price movement to be greatly under emphasized, and significant declines/lows in 1987, 1990, 1994, and 1998 appear as mere blips.
The next 4-Year Cycle price low is due in October of this year. Subordinate cycles suggest that the low may arrive a few months on either side of that projection, and there is no guarantee that the decline will play out in a straight line. For now we should be looking for some above average difficulty between now and the end of the year.
Fundamentals also present problems for the market. The next chart shows the index of S&P 500 earnings and a presentation of the P/E ratio based upon prior peak earnings, a methodology developed by John Hussman (hussman.com). As you can see, over the long term earnings have trended higher in relation to a trend line that rises at an average of about 6% a year, and the current earnings peak is very close to that trend line. This has been the situation for the last two years, and could account for the market's slow progress during that time.
Currently, the P/E has remains at a level where, except for the bubble years of 1998-2002, the market at best had trouble making forward progress, and at worst experienced major declines. This will be a significant drag on the market until the P/E can correct back toward the area of 15, which represents fair value. A correction to undervalue (10) could also happen, but that is a rare occurrence and not necessary to set up favorable conditions.
CONCLUSION: Normal cyclical expectations and high valuations present significant obstacles for the market this year, and the bull/bear cycle suggests that a significant decline will occur between now and the end of the year. That said, I should point out that Decision Point's timing models for the broad market remain on buy signals, and the trend is up. The odds favor a decline this year, but the top isn't in place yet.
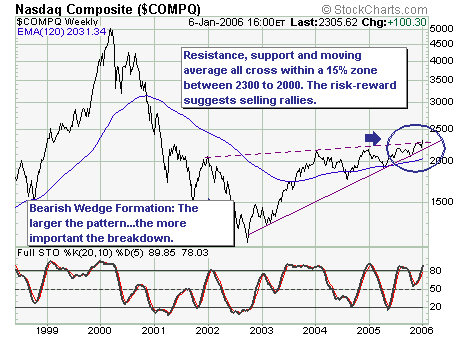
The first 4-days of US trading has shown nothing but gains; and we believe that this “euphoria” is providing an upcoming opportunity to be come short the technology sector as a whole. Allow us to explain:
Using the weekly NASDAQ Composite chart, the rally off the low has clearly traded within a well-defined bearish rising wedge pattern. In fact, it has gone further into the apex that we would have thought, which last week saw prices breakout very modestly above trendline resistance. Common technical convention notes that the further along the apex – the higher risk of “false breakouts”; we think this is just such a circumstance. Therefore, we will soon opt to begin accumulating short positions in selected technology shares such as F5 Networks (FFIV)…perhaps next week; if not…then soon.