Jitters have crept back into the stock market with last Friday's big drop in the major averages. In addition to breaking the Dow's low from the start of the year, Friday's selloff ended with the first close below the 50-day moving average since the end of October.
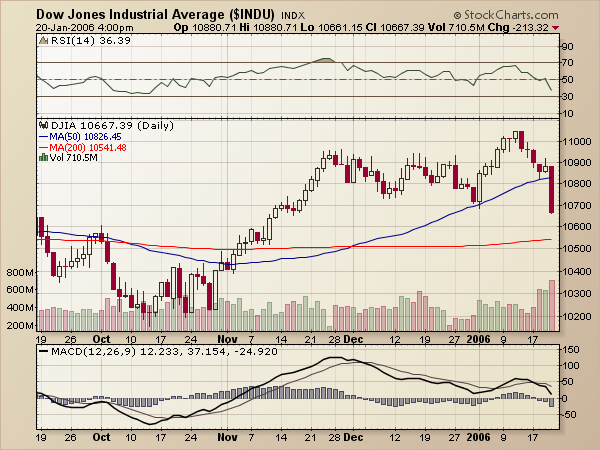
Note also that the RSI is now lower than it has been since late October as well and that the MACD is probably going back below zero soon. Finally, notice that Friday's volume was the highest the Dow has seen in quite some time. If prices don't immediately rebound Monday morning, look for the next support level to be around the 200-day moving average which is currently moving sideways near 10,550.
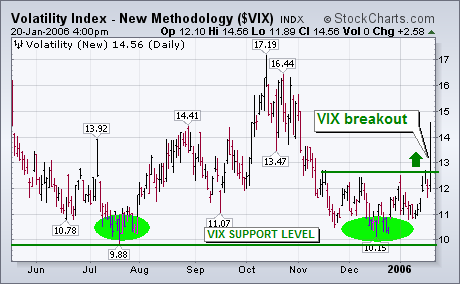
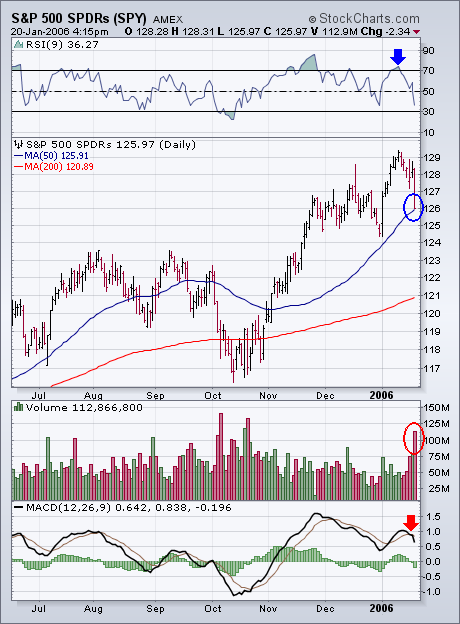
A week ago Thursday I wrote a message entitled: "Low Volatility (VIX) Index May Increase Market Risk in 2006 -- S&P 500 Pulls Back From Overbought Condition" (January 12, 2006). The next two charts are updates of the ones shown at that time. I was concerned that a rising VIX from the lowest level in a decade could start to put downside pressure on an overbought market. So far that has been the case. Chart 1 shows the VIX breaking through its December highs to register an intermediate upside breakout. It's no coincidence that the jump in the VIX accompanied heavy stock selling. Chart 2 shows the short-term damage done to the S&P 500 SPDRs. Although the SPY closed right on its 50-day average, the daily MACD lines turned negative after failing to confirm the recent price move to new highs. Heavy downside volume is also negative. The last time the SPY saw such heavy trading was around its October lows. Heavy selling after a price decline often signals a bottom. Heavy selling after a price rise usually signals a top. This looks more like a top than a bottom. The blue arrow on the RSI line shows the "negative divergence" that I wrote about on January 12. After expressing concern about that divergence, I suggested that "this looks like a good time for short-term traders (or those looking for an excuse to take some January profit) to do so". Today's downside action suggests that it's time to do some more selling.
Wall Street took a pounding on Friday and the Dow took the biggest technical beating of all the major indices. The Nasdaq, S&P 500 and Russell 2000 all remain above their 3-Jan lows, but the Dow broke below its 3-Jan low. This shows relative weakness and bodes ill for the Dow.
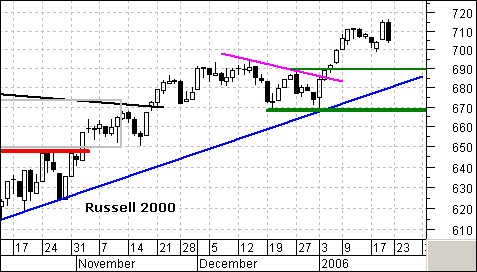
The Dow Diamonds (DIA), which is the ETF that corresponds to the Dow Jones Industrial Average, broke falling flag resistance with a move above 109 the first week of the year. This signaled a continuation of the November advance, but that signal has been reversed in a major way.
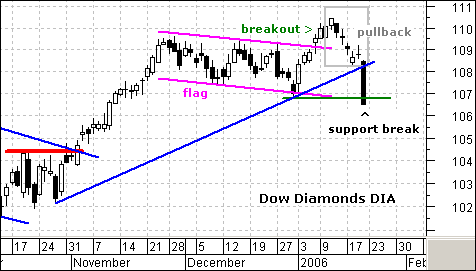
After a ~3% move the first two weeks of January, the Dow Diamonds (DIA) became overbought and ripe for a pullback. The breakout was still valid, but the stock needed to digest gains and work out the overbought condition with a correction or consolidation. Broken resistance at 109 turns into support and there was support at 108 from the October trendline. A strong stock should be able to hold its breakout and trendline (gray box). With Friday’s sharp decline the Dow Diamonds (DIA) not only failed to hold its breakout, but also broke support from the January low. This is not the stuff bulls are made of and the Dow is in for a rough ride.
While mining gold has become very profitable, there are many signs that future prices are being undermined. For example, our first chart shows total assets and cash flow for Rydex Precious Metals Fund. While assets have risen along with price, cash flow (the bottom panel on the chart) reflects that money has actually been flowing out of precious metal stocks. This means that the rally has very thin support.
SIDEBAR: We are seeing similar divergences across a wide range of Rydex index and sector funds.
Our next chart of the gold ETF shows that a similar technical divergence is affecting the price of gold as well. Note how the December and January OBV (on-balance volume) peaks were about equal and failed to confirm recent highs. Also, OBV during the last two weeks' rally has been virtually flat -- again failing to confirm the price advance, and implying that distribution is taking place.
Finally, sentiment for gold is becoming very bullish, as demonstrated by our last chart which shows the premium/discount being paid for Central Fund of Canada (CEF), a closed-end fund that owns gold and silver. Closed-end funds trade like stocks and can trade at a premium or discount to the actual net asset value (NAV) of the fund's assets. Currently, in their rush to own gold, investors are willing to pay nearly 10% more than the fund's assets are actually worth.
Conclusion: Both gold and gold stocks are overbought and showing signs of internal weakness. Bullish sentiment is becoming excessive. All this evidence implies that a correction us due. It could be a short-term event lasting a few weeks, or it may stretch out over several months, and the amount of the correction could be quite jarring; however, I have no reason to conclude that the bull market in gold is over. It is time to guard stops and be patient until the technical problems have cleared, and another buying opportunity presents itself.


