The markets did great this week with the Dow hitting record highs and closing in on 13,000 however almost no one here at StockCharts.com was paying much attention. As most ChartWatchers know, we spent much of the week wrestling with technical glitches. I thought I'd take some time to explain what we've learned about the problems and the steps we are taking to prevent them from happening again. If you are not interested in computers and networks, now might be a good time to skip down to the other articles  .
.
About a year ago we started upgrading all of the equipment here at StockCharts.com from the slower 100 Megabit networking speed to the newer 1 Gigabit speed. (Most home networking equipment works at 100 Megabits although - like us - you can upgrade your stuff to 1 Gigabit relatively inexpensively these days.) Upgrading our network to the faster speed has many benefits to all of our users: our servers send around stock price data faster, the charts we create get sent out faster, we can backup our server data faster, etc. In order to upgrade a network, you have to replace (or upgrade) both the computers and the switches on the network. (A switch is a device that connects all of the wires from all the different computers. Most home networks have a switch built into the router/firewire device that the broadband modem plugs into.)
Now, there is a hidden problem with upgrading the speed of any network - a problem that most of the network equipment people don't tell you about. With few exceptions, there is always a point where your high speed network meets a slower speed device. In our case, our three connections to the Internet work at 45 Megabits and so, at some point, all of our outbound traffic has to slow dramatically in order to get out one of those wires.
The situation is analogous to a sink with a slow drain and a big faucet. The slow drain represents the slow connections to the Internet, The big faucet represents the fast connections to our charting servers, and the water represents all of the bits that make up our charts. The overall goal of the network is to keep the sink from overflowing.
If the water is able to go down the drain as fast as it is coming out of the faucet, everything is fine. The sink remains almost completely empty. Even if there are occasional high-speed bursts of water from the faucet, things are probably fine also. The extra water just stays in the sink until the drain has a chance to "catch up." The sink "buffers" the extra water for the drain.
Problems happen when the amount of water coming out of the faucet exceeds the amount of water going down the drain for a "long time" and the sink becomes completely full. At that point, any additional water that comes out of the faucet will get spilled (i.e., lost).
Coming back to the world of networking, this process of "buffering" (i.e., the sink) happens inside whichever device is connecting the high-speed network to the slower speed network - typically the switch (or the router/modem in most homes).
Now, when we started to upgrade our network to gigabit speed, the first thing we did was go out and buy some very nice, high-speed switches from a very well known network equipment manufacturer. Where a consumer level gigabit switch might cost $50 these days, the ones we got cost several thousand dollars (which is typical for enterprise networking). In return for that money, we supposedly got three things - long-lasting hardware, big sinks, and software that would tell us if the sinks ever overflowed. (See where I'm going with this?)
Ultimately, most of last week's problems were caused by a buffer overflowing inside one of those new switches. That is no surprise to any of us - it was one of the first things we looked for. The bigger problem was that everyone was confused by four facts:
The switch didn't give us any indication that it was having problems.
Everything had been working great up until last Wednesday.
Even at our busiest times, we were only sending out about 70 megabits of data - much less than the 100 megabits that our "drain" allows.
When data went out through our slower
ISP, everything worked fine.
Ironically, the answer to the mystery lay in the article that I wrote in the last newsletter - the one where I sort of bragged about how much faster we were able to generate charts these days. By increasing the speed at which we create our charts, we metaphorically increased the speed at which water was bursting into the sink from the faucet. The result was an overwhelmed sink and thus, data loss.
The immediate solution was to slow our network back down to 100 megabits. That smoothed out the flow of data and stopped the data loss at the switch. Obviously that is not the right long-term solution though because we lose all of the other advantages of gigabit networking. The long-term solution is to upgrade our switches to ones with HUGE sinks (i.e., memory buffers) which we will be doing this weekend. Once that work is complete, you can expect our site to be faster than ever.
In case you missed the announcements on the website, we have credited ALL subscribers with an additional two free weeks of service to make up for last week's problems. Thanks for continuing to support StockCharts.com.
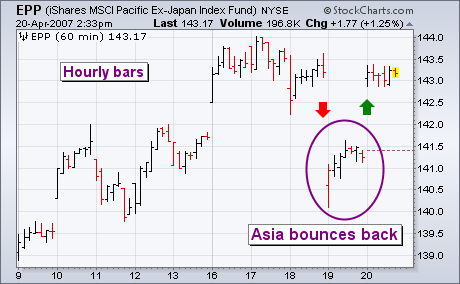
Thursday's 4.5% drop in Chinese stocks caused nervous selling in other Asian markets. By the time the U.S. market opened, however, Europe had already started to recover and initial U.S. losses were modest. By day's end, the Dow had closed at a new record high. A strong Friday open in Asian markets set the stage for a strong day in global stock markets. Chart 1 is an hourly bar chart of the last ten days. It shows the Pacific Ex-Japan iShares (EPP) gapping down on Thursday (red arrow). The good news is that the EPP then gapped back up on Friday (green arrow). Thursday's isolated price bars (see circle) created an "island" bottom which is a short-term bullish pattern. [An ""island"" bottom occurs when a "down gap" is immediately followed by an "up gap"]. The U.S. market also got a big boost from large industrials like Caterpillar and Honeywell which led the Dow Industrials to a new record high. A big jump in Google pushed the Nasdaq up against its 2007 highs. Commodity markets like gold and oil that pulled back on Thursday (owing to concerns about higher Chinese interest rates) recovered strongly on Friday. Commodity-related stocks ? like basic materials, energy, and precious metals ? were among Friday's strongest groups. A weaker dollar is continuing to feed the commodity rally.
The Dow Diamonds (DIA) moved to a new all time high this past week and the S&P 500 ETF (SPY) recorded a multi-year high. En route to these highs, both exceeded their late February highs and large-caps are showing relative strength. In addition, both gapped higher on Monday and held these gaps throughout the week.
On the other side of the market, the Russell 2000 iShares (IWM) is having trouble with resistance from the late February high and small-caps are showing relative weakness. The ETF also pulled back rather sharply on Thursday and actually filled Monday's gap. IWM bounced back on Friday, but remains at resistance and has yet to breakout. The price relative (IWM:SPY) further confirms that IWM is not as strong as SPY. The indicator has been overlaid the IWM chart and it formed a lower high in April.
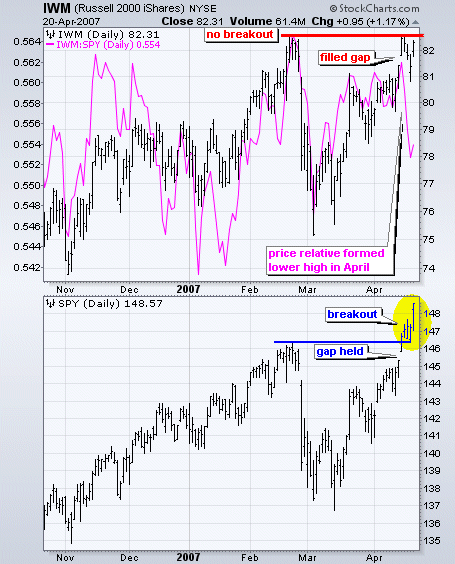
IWM is close to a breakout and a move above the February high would affirm the breakouts in SPY and DIA. Failure to breakout would show continued weakness and this would cast a shadow on the current rally. At the very least, relative weakness in IWM means we should favor large-caps over small-caps in the coming weeks and months.
Back in November 2006 I speculated that the 4-Year Cycle trough had arrived in June/July 2006, and that the implication was bullish for stocks ? bullish because we normally expect an extended rally out of those cycle lows. At this point, I think that assessment is proving to be correct because there has been a substantial rally, and the recent correction low has failed to challenge the 2006 lows. In other words, the first leg of the current 4-Year Cycle has shown unusual strength, and it is reasonable to assume that there could be a few more good up legs before the bull market finally tops out.
In a shorter-term context, we can also note that the March low also marks the cycle trough for the 9-Month Cycle that began last summer in conjunction with the 4-Year Cycle. I had expected the 9-Month Cycle trough to arrive this month (around April 16), but, since the S&P 500 has already exceeded its February high, I have to accept the March 14 low as being the cycle trough ? having arrived one month early. Another feature of that cycle is that the high price point in the cycle (the crest) is located on the extreme right side of the cycle arc. This is a bullish configuration.
Assuming that we are beginning a new 9-Month Cycle, and assuming that the bullish configuration (right-hand cresting) persists, it will be about six months or more before the next important price top arrives. Regarding this estimate, I would pencil it in, rather than using chisel in stone.
A casual examination of the cycle chart will reveal that there really is no typical cycle configuration, and the spacing between troughs can be terribly inconsistent for the 9-Month Cycle and subordinate (shorter) cycles; however, cycle analysis does provide a certain context that can be applied to price movement, which can be useful to the intuitive side of the brain.
Bottom Line: Cycle analysis is an imperfect tool, but current cycle orientation is more clear than usual, and it is bullish for stocks, probably for several months.
Look for Tom's commentary next time.
The positive stock market rally is undergoing significant "rotation" within various indices, which in our opinion is quite important from both an investment and trading perspective. First, when we invest or trade, we want to run with the "fastest horses" in order to outperform the markets or one's particular benchmark. Therefore, it behests us to use technical analysis on specific ratio charts to discern where to put our money in order to earn outsized profits. This is relative investing 101. Last week, we will note that the large caps handily outperformed the small caps. This is a trend that has been ongoing for the past year, but one that hasn't really gotten the attention of the hedge funds and hot money. Well, that is about to change, and the media will begin to pick up on this material change and it shall have repurcussions throughout the trading world. If we analyze the ratio chart between the S&P 500 Large Caps (SPY) and the Russell 2000 Small Caps (IWM), we find a "major low" was forged in April-2006, and since then the ratio has held above its low and formed what appears to be a "right shoulder" of a larger "head & shoulders bottoming pattern." This is of course hugely bullish, for it portends months and years of outperformance by the large caps such as Wal-Mart (WMT), Citigroup (C), 3M (MMM) and Pfizer (PFE).
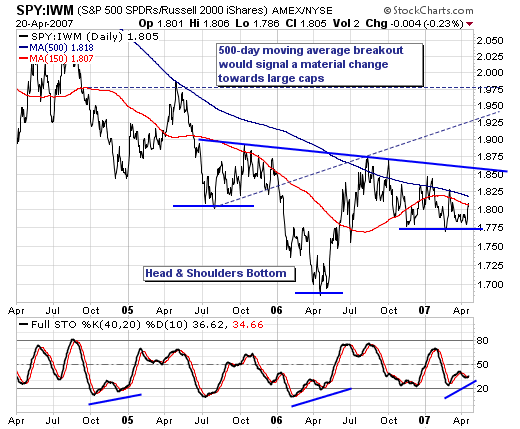
For this bullish pattern to be confirmed, a move above neckline resistance at 1.86 is required; however, we would become more confident a breakout is developing with a breakout above the longer-term 500-day moving average. The 40-day stochastic is showing strength from a higher low, which further increases the probability this bullish pattern will come to fruition. In other words, the ducks are lining up rather nicely.
And finally, we would also note that SPY isn't only poised to outperform IWM; it showing bullish technical patterns against European and Asian regional indices...and perhaps more importantly...the Emerging Markets. Hence, when we are long - we want to be long large caps; when we are short - we want to be short small caps and certain foreign regions or indices. It's just that simple right now.

 .
.


