Recently, we've seen a big increase in the number of people sending in questions about our scanning feature. Here's an article that I wrote about creating and running scans waaaaay back in October of 2002. While the example scan's results and charts are out of date, the lessons about creating effective scans are not. Enjoy! - Chip
The job of a ChartWatcher is simple: 1.) Determine the Market's overall trend. 2.) When that trend is up, find promising stocks that have just started to move higher. 3.) Use sensible money management techniques to enter and exit positions in those stocks.
In the past, we've covered many techniques for determining the Market's current trend. Today, I wanted to talk more about the second step - finding stocks that are starting to move higher. We'll start by using our Standard Scan Engine interface to create a simple scan for finding turnaround candidates, then we'll refine that scan by using features from our Extra service.
(If you are new to the process of scanning for stocks, I recommend that you read our introductory ChartSchool article to get a broad overview of the concepts we'll be covering below.)
So, we want to develop a scan that finds stocks that have recently started moving higher. Unfortunately, the phrase "recently started moving higher" is not as well-defined as the Scan Engine needs it to be. How recent? How much higher? Does the move up have to be continuous or can it have some down days in it? How many down days? Etc., etc., etc.
While it's extremely powerful and flexible, our Scan Engine cannot read minds. It is up to us to find a unique set of technical criteria for the kinds of charts we are hunting for. I usually start by visually reviewing the charts of popular stocks like INTC or MSFT looking for a "setup" similar to what I described above. For example, look at the INTC chart below and see if you can find a time where the stock rose nicely after a long decline. How about the nice increase that happened from October to December of last year? That looks pretty good..

Here's where a strong understanding of each technical indicator we offer really pays off. After finding a chart with the "setup" you want, you need to spend time looking at how various indicators behave around that time. Look for crossovers, extreme values, or divergences since those are things that the Scan Engine understands.
As you can see in the INTC chart, I've kept things very straightforward by using two simple moving averages and the RSI indicator. Do you see where the 20-day Simple Moving Average (SMA) crossed above the 50-day simple moving average soon after this uptrend began? Let's create a scan based on that observation and see what it returns.
We can create such a scan very easily using our Standard Scan Interface. Start by selecting the appropriate global filters such as stocks from "Any" group, whose "Avg. Close >$1.00", and "Avg. Volume >40,000". These settings ensure that only market forces are affecting the price of the resulting stocks.
Next, move down to the "Additional Technical Criteria" area and select "SMA Close" from the dropdown on the left, and enter "20" in the parameter box next to it. Now, find the "x" entry in the Comparison operator dropdown box - that's the "Crosses Above" operator. Finally, select "SMA Close" from the next dropdown and enter "50" in the parameter box. Now click "Update Criteria" and you should see the following in the Light Blue Criteria Box in the middle of the page:

If everything looks good, click "Run Scan" and wait for the results to pop up in a new window. When I run that scan this weekend, I'm getting 26 results include Yahoo and Amgen. Unfortunately, upon closer examination, not all of these stocks have charts with the same "setup" as that INTC chart above. Here are six charts from the 26 returned by the scan:

(Visually reviewing scan results in this mini-chart format is very easy for Extra members - simply store the scan results in a favorite list and then pull up the list in "CandleGlance" format.)
Let's start with the best looking chart of the lot - LUX. LUX has widely separated moving averages that swoop in from the upper left corner of the chart, cross below the price bars just after the turnaround happens and then cross each other shortly after that, confirming the new uptrend. Using my unorthodox analogy from two issues ago, LUX is a horse making "the turn for home." EMIS and YHOO are charts with the same "setup" pattern and prove that our scan is finding the stocks we are after.
Unfortunately, the scan is also finding stocks with completely different chart patterns - stocks like CELL which has been moving sideways for sometime and thus has "tangled" moving averages that are crossing and re-crossing way too frequently to be meaningful. Alderwoods Group (AWGI) has a similar problem - note that almost every bar on that chart crosses the 20-day SMA. Because these charts are so different from what we want, we need to improve the "selectivity" of our scan by adding more criteria lines designed to screen out these charts. Again, studying ChartSchool articles, studying lots of charts, and testing lots of scan ideas is the best way to learn about this process however I've included a big hint on the charts above. Do you see it?
LUX, EMIS, and YHOO all have RSI values that are close to 70 while AWGI and CELL have RSI values near 50. Adding the criteria line "RSI(14) > Constant= 65" to the scan above reduces the number of results from 26 to 12 - including LUX, EMIS, and YHOO but not including our "problem" charts AWGI and CELL.
Which brings us to PRV - a great example of why using several different indicators in a scan can really pay off. On the surface, the PRV chart above has a nice looking moving average crossover very similar to the other ones I discussed however, at only 53, its current RSI value is much lower than it ought to be given such a strong looking crossover on the chart. That indicates that this stock's turnaround may not be as strong or as long-lived as the others.
So, is this scan done? Is it a path to riches in today's market? Back-testing can help you make that decision yourself. When I run this scan "Starting 5 days ago", it returns two results - LPNT and STCO. You can use our PerfChart tool to see how those stock have fared in the ensuing 5 days. (Ed. Note: Umm, STCO doesn't exist anymore, but trust me, the PerfChart looked awesome back in 2002.) While there are many other factors involved, the strong performance of a scan's results is obviously very important.
Iteratively creating a scan and testing its effectiveness using these techniques is what ChartWatching is really all about. I urge you to use the tools that we provide to seek out chart "setups" that you can back-test, paper trade, and ultimately use to improve your portfolio.
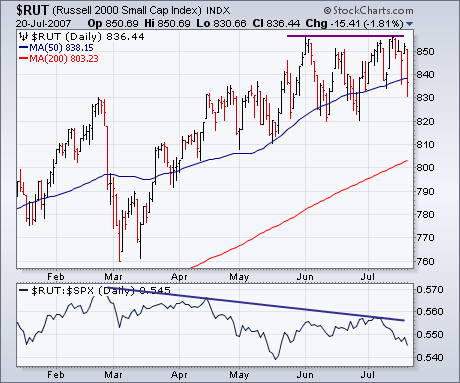
I suggested Friday that part of the recent weakness in market breadth figures was most likely due to the fact that most of the recent buying has been in large cap stocks, and that small cap indexes had yet to hit new highs. That discrepancy is shown in the chart below. The Russell 2000 Small Cap Index has been unable to clear its early June peak. [The same is true of the S&P 600 Small Cap and the S&P 400 MidCap Indexes]. The relative weakness in small caps is even evident in today's market selling. Small caps fell much harder than large caps. Below, the RUT is in danger of breaking its 50-day average. The RUT/S&P ratio at the bottom of the chart shows small caps lagging behind large caps throughout the latest market upleg. That's where a lot of the breadth deterioration is coming from. A lot of the breadth weakness is also coming from a continuing breakdown in financial shares. That's because the financial sector has the heaviest weighting in the S&P 500. Financials stocks have been lagging behind the rising market for months and are today's weakest sector. So is anything tied to housing.
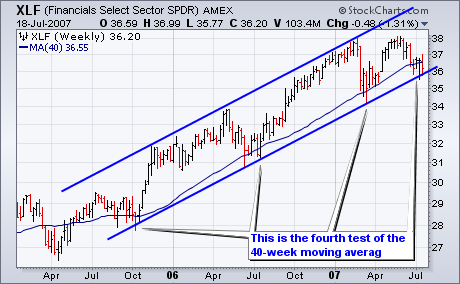
Despite a sharp decline over the last six weeks, the Finance SPDR (XLF) remains in a long-term uptrend on the weekly chart and support is at hand. The Finance SPDR (XLF) met resistance at 38 twice this year and declined to around 36-36.5 in June and July. The lower trendline of a rising price channel and the 40-week moving average mark support here. The 40-week moving average is equivalent to the 200-day moving average (40 x 5 = 200) and the 40-week held in October 2005, July 2006 and March 2007. This key moving average is getting a big test once again and a move below the July low would solidify a break. This would also break the lower trendline of the rising price channel and the long-term implications would be bearish.
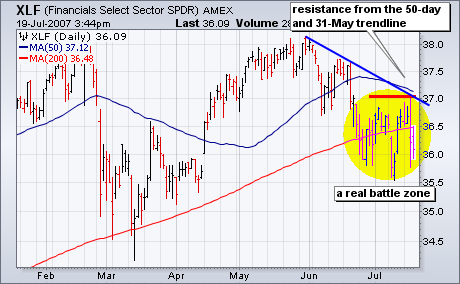
As long as XLF trades near long-term support, the decline on the daily chart could be a mere correction and a trend reversal would be quite bullish. The 31-May trendline, 50-day moving average and July highs established resistance at 37. XLF needs to break above this level to reverse the downtrend on the daily chart and resume the uptrend on the weekly chart. However, the medium-term trend is down as long as resistance at 37 holds and traders should be on guard for a break below the July low.
On Thursday our trend model for gold switched to a buy, which means our medium-term posture is bullish on gold; however, when I looked at a very long-term chart of gold I saw something that gave me a slightly queasy feeling. What I saw was that gold is forming a pattern now that has very similar dynamics to the one that preceded gold's crash in the early 1980s. Note the huge parabolic blowoff top in 1980, followed by a failed rally top, followed by the crash.
While the current pattern is not as exaggerated as the earlier one, the dynamics are the same â a blowoff top, followed by a rally that has so far stalled below the previous top. To be objective, we must acknowledge that the rising trend line is still intact, but the similarity between the two patterns should keep us on edge until the current pattern is resolved.
One of the factors that will have a strong influence on the future price of gold is the strength or weakness of the dollar. On the chart below we can see that the U.S. Dollar Index is challenging major long-term support. If it breaks down through that support it will be great news for gold, but, if the dollar rallies off the support, we should expect to see gold break down through its rising trend line.
Bottom Line: The outlook on gold is positive at the moment, but there are technical and fundamental issues that could result in a nasty downturn for gold. If this happens, I would expect the support at $500 to be challenged. It appears to me that this situation should be resolved in a matter of weeks.
We discuss so many different technical scenarios that sometimes we lose sight of what history has taught us. It's time to pause for a bit after a very nice rally in the equity markets and see what history has to say. For purposes of this discussion, all numbers below relate to historical performance on the S&P 500.
At Invested Central, we focus a great deal on historical tendencies and we believe you should too. There is overwhelming evidence that suggests viewing a calendar from time to time can immensely improve your trading or investing results. Let me give you a few historical facts to ponder, many of which you may already be familiar with.
Since 1950, the S&P 500 has advanced more often during the month of December than any other month. The ratio of advancing months to declining months for each calendar month can be seen below:
January: 36 times higher, 21 times lower
February: 31-26
March: 37-20
April: 38-19
May: 32-25
June: 30-27
July: 31-26
August: 31-26
September: 24-32
October: 34-23
November: 39-18
December: 43-14
Perhaps the biggest surprises on this list are April's 3rd place finish behind December and November, and September's dismal showing.
Now let's look at annualized returns from each month:
January: 17.01%
February: -0.24%
March: 11.97%
April: 14.77%
May: 3.12%
June: 3.18%
July: 10.53%
August: 0.50%
September: -7.19%
October: 11.01%
November: 20.93%
December: 20.46%
There are no huge surprises as the November thru January time period are the three best consecutive months to invest while the July thru September time period are the three worst.
We also study the historical trends on the NASDAQ and Russell 2000 to identify tendencies and we've found similar results, although the May and June months are much stronger for both the NASDAQ and Russell 2000, while March and July tend to be much weaker.
If your tendency is to attempt to improve your results via leveraging strategies, consider using the above historical tendencies to time your strategies more effectively.


