Hello Fellow ChartWatchers!
In my last article, I went over two key Intermarket relationships - the one between the US Dollar and Commodities and the one between Commodities and the US Stock Market. (Keep in mind that John Murphy and Arthur Hill describe new Intermarket developments every day in the Market Message area of the website.) This time I wanted to go into some more detail about that second relationship - the one between commodity prices and the US Stock market.
Last time I showed how there is a very strong positive relationship between stocks and commodities right now. We also saw that that relationship hasn't always been as strong. In fact, as the chart below shows, things have been pretty unusual since 2008:

(Click on the chart for a live version.)
Going back before 2008, if you look more closely, you can see distinct time periods where the correlation line had a bias towards the positive side and then a bias towards the negative side.
Unlike the period since 2009, most Intermarket charts are not 100% precise. Interpretation is involved. The trick to determining the dominant relationship during a given time period is to look at how the correlation line behaves after it crosses zero. If the line immediately moves back across zero or bounces at zero, that's a good indication that the correlation has not really changed.
For example, take a close look at the period between 2004 and 2008. Notice that the line was above zero more than it was below it. Also that the line only remained below the line for brief periods of time. Notice also that this effect is stronger in 2004 and 2005 than it is in 2006 and 2007 - a sign that things were breaking down going into the crisis of 2008.
Why is this important? Each time there is a generally positive correlation on this chart, it means the economy is in a deflationary environment where stock prices and commodity prices are strongly coupled. Each time that black line stays in negative territory, the economy is in an inflationary mode where rising commodity prices are bad for stocks. This chart will give you that critical piece of information well before economists and the financial press do.
For example, going back further on the chart, can you spot the exact moment where the current Deflationary environment began? The large jump into positive terrtory at the start of 2001 was the moment where the correlation changed significantly. The events at the end of 2001 and 2002 muddied the picture somewhat, but by late 2003 it was clear we were in a deflationary scenario - which we are still in.
Notice that prior to 2001, the correlation line had a negative bias (inflation). See how it tried and failed repeatedly to move above zero in 2000? Again, it's not precise, but you can see how the black line generally stayed below the zero line from mid-1996 through the start of 2001.
Going back further, there was a short period of positive correlation (deflation) from roughly 1993 until mid-1996. Prior to that, there was a long period of negative correlation (inflation) starting around 1985.
So I'll leave you with this question: Given what we just learned, what would it mean to your portfolio if the black line suddenly moved below zero for the first time in almost 4 years? That is the value of Intermarket Analysis.
- Chip
An impressive upside reversal day on Wednesday enabled the Power Shares US Dollar Index (UUP) to bounce off its 200-day moving average as shown in Chart 1 (see arrow). That dollar turnaround was apparently the result of Mr. Bernanke omitting any mention of QE3 in his testimony before Congress that day. That's dollar friendly since infusions of more money into the system resulting from Fed bond purchases weakens the dollar. At the same time, the European Central Bank (ECB) spent more than expected on the second round of its Long-Term Financing Operation (LTRO). LTRO involves three-year loans to European banks at 1%. That had the effect of weakening the Euro. The immediate reaction in all of the financial markets was fairly dramatic. Stocks sold off in the heaviest trading this year. U.S. bond yields jumped. [Fed buying of longer-dated bond maturities has kept yields unusually low]. The biggest gainer was the U.S. dollar. The biggest losers were precious metals.

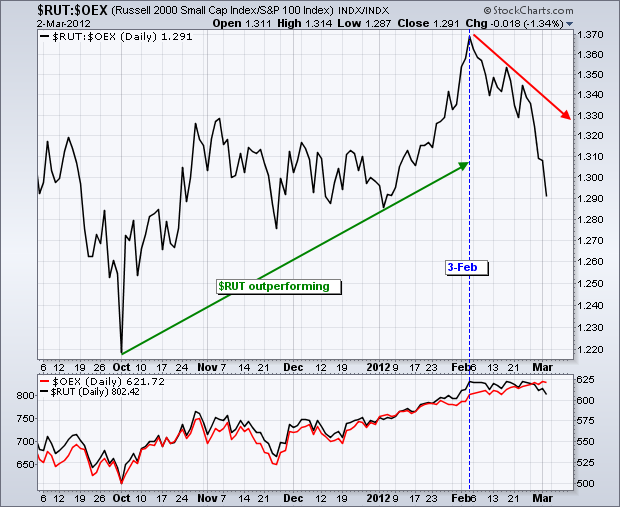
Relative weakness in small-caps remains a concern for the broader market. Smaller companies are less diversified and have less exposure abroad, which makes them more vulnerable to changes in the domestic economy. As such, small companies are like the canaries in the economic coal mine. They are the first to benefit from an upturn in the economy, but also the first to suffer from a slow down. Chartist, therefore, should keep an eye on small-cap performance for clues on the economy.
Click this image for a live chart.
The chart above shows the performance of the Russell 2000 ($RUT) relative to the S&P 100 ($OEX) using the Price Relative ($RUT:$OEX ratio). This ratio rises when small-caps outperform and falls when small-caps underperform. Small-caps outperformed in October and January with a bout of flat performance in between (November-December). February was a different story as the $RUT:$OEX ratio fell rather sharply and continued lower the first two days of March. Life is tough for indices that do not include Apple, which features in the Nasdaq, Nasdaq 100, S&P 100 and S&P 500.The blue dotted line marks the start of underperformance on February 3rd. With the Russell 2000 breaking its February lows on Friday, it looks like small-caps are starting a correction that could extend to the broader market.
At Decision Point we keep a close watch on asset levels in the Rydex mutual fund group as a way of evaluating investor sentiment. An important result of these efforts is the Rydex Asset Ratio, which is calculated by dividing assets in the Bear plus Money Market Funds by the assets in the Bull Funds.
On the chart below we can see that the Ratio has reached the highest level in 10 years, which shows an unusually high level of bullishness on the part of Rydex investors. Based on previous Ratio tops shown, we can assume that prices are likely to correct or consolidate at the very least.

Digging deeper into the numbers, the following chart shows that Money Market Assets are near 10-year lows, which indicates that Rydex investors have very little money on the sidelines with which to make an additional commitment to bullish positions. Also, Bear Fund Assets are near 10-year lows, demonstrating that Rydex investor expectations for bearish outcomes is very low. These bullish attitudes are bearish for the market because it appears that there are very few resources left to fuel a continued price advance.

When we analyze Rydex assets we assume that this tiny slice of the market more or less represents what is happening in the broader market. This may or may not be the case. For example, Rydex investors could have other cash reserves located somewhere other than in the Rydex system. Nevertheless, Rydex asset analysis appears to be a useful addition to our technical toolbox.
In earlier articles, I wrote about key upcoming resistance on banks and the "January Effect". Very strong performance in January suggests that equities will continue to rally throughout 2012. If the recent performance in the banking industry is any indication, consider it confirmation.
If you study history, you'll find that the stock market performs very well when banks are leaders. Since the mid-December low, the S&P 500 has risen 13.91%, while banks have led the advance, gaining 24.80%. This is a complete turnaround from 2011. The S&P 500 finished flat for the year while banks fell 24.57%.
From a fundamental perspective, I spent nearly twenty years in public accounting on the audit side. Banking was one of my areas of expertise. I can tell you from experience that bankers, by and large, are a VERY conservative bunch, despite all the shenanigans that took place in terms of leveraging in the early 2000s. When banks are not performing well, access to credit is denied in many instances where it normally would be approved. Think back to the credit crisis in 2007. Do you recall what happened to overall stock market performance? It was one of the worst bear markets in our history. GDP turned negative and millions of jobs were lost as many companies found it difficult to even borrow the necessary funds to meet payroll. That type of credit crunch and poor behavior by banks is toxic for equities.
But on the flip side, improving health at banks generally leads to easier access to credit. That, in turn, leads to economic improvement, growth and hiring. The relative performance of banks in 2012 tells me that this rally is probably closer to its beginning than to its end. In fact, I believe equities are heading MUCH higher in 2012. That differs from my forecast just 2-3 months ago, but the recent performance of banks makes it necessary to adjust my thinking.
Before we take a look at banks, the market does have to deal with negative divergences on the daily charts of many indices, sectors, ETFs and individual stocks, which abound. This is a sign of slowing momentum in the near-term. It would be best technically if we were to unwind these negative divergences and "reset" the MACD closer to its centerline support. Let's take a look at the NASDAQ first as it's been one of the stronger indices in 2012.

Last week, we saw a bearish engulfing (reversing) candle print on the NASDAQ on increasing volume. Personally, I grow more cautious near-term when I see slowing momentum present on the daily charts and then it's reinforced with an increasing volume, reversing candle. That's generally when I review the longer-term chart to see if the weekly divergences also show slowing momentum. Take a look at this weekly chart of the NASDAQ:

As you can see above, momentum on the longer-term weekly chart is SUPERB. Any time I see a MACD that's recently cleared its centerline and is pointing up and moving further from the centerline, that's a sign of strong and increasing momentum over the intermediate-term. Therefore, I believe the NASDAQ could benefit from a short-term consolidation period, even a bit of outright short-term selling, before another strong leg higher ensues. The interesting part is that a long-term negative divergence many times will result in a 50 period SMA test. A pullback during a period when the MACD is strong many times will result in a 20 period EMA test. On the charts above, the 50 day SMA (on the daily chart) and the 20 week EMA (on the weekly chart) are at 2805.09 and 2767.84, respectively. Both are rising, however, so a test could take place somewhat above those levels.
The negative divergence on the NASDAQ's daily chart is just one example of the problems that market bulls face in the near-term. But the long-term looks much better and much less suspicious. The performance of banks is one reason for that. The relative performance of banks vs. the S&P 500 has obviously improved. One quick look at chart below and I think you'll agree:

On Tuesday night, I'll be hosting the latest in Invested Central's Online Trader Series (OTS). This month's topic will center around the banking industry and I'll take a look at the relative performance of banks throughout the years and plot that against overall S&P 500 performance. It's one of the keys in determining whether a rally is sustainable or not and I think you'll find it both interesting and thought-provoking. For more information, CLICK HERE


