 |
Delivering The Web's Best Financial Commentary Straight To Your Inbox
|
| April 15, 2017 |
Hello Fellow ChartWatchers!
Welcome to the latest edition of ChartWatchers, the newsletter for technical analysts, online investors, StockCharts users and more. In addition to this week's articles, don't forget to check out the Site News section (below) for some important announcements and updates about what's going on around StockCharts this month!
Enjoy!
- Grayson Roze
Having trouble viewing this email? Click Here to view online
|
|
|
|
The new Members Dashboard is now in beta!
We're excited to announce that our new-and-improved Members Dashboard is now in beta! The re-designed layout is more intuitive, easier to use, and has been optimized for all screen sizes. Plus, we've added some powerful new features, including a more robust Control Center, a Market Overview panel, an Alert Center and the ability to delete multiple ChartLists at once! Click Here to access the beta version of our new Members Dashboard, or look for the blue banner at the top of the current Members page. As we continue to fine-tune the design, we want to hear from you! Check out the new dashboard and let us know what you think.
|
|
|
|
|
|
|
by John Murphy
|
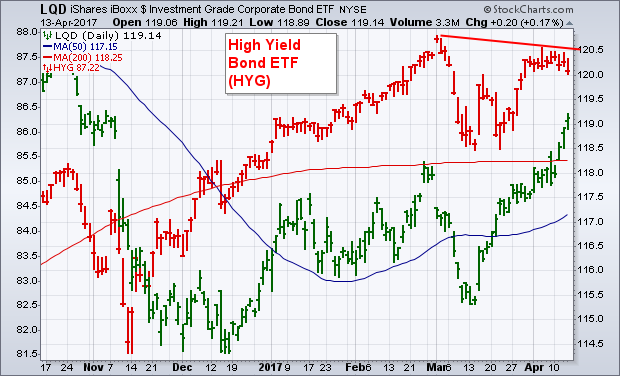 |
The green bars in the chart below show the iBoxx Investment Grade Corporate Bond iShares (LQD) trading at a new five-month high after clearing its 200-day average. The red bars, however, show the iBoxx High Yield Corporate Bond iShares (HYG) backing off from its early March high. The fact that investment grade bonds are rising, while junk bonds are weakening... |
|
|
|
|
|
|
by Arthur Hill
|
 |
Most of us are aware of the tracking error between oil and the US Oil Fund. There is indeed a tracking error, but a few charts reveal that this tracking error is subject to fluctuations and can even remain stable for extended periods. Today I will show how to measure tracking errors between ETFs and the underlying asset. Gold and oil will be used for examples, but these techniques can be |
|
|
|
 |
|
|
|
by Greg Schnell
|
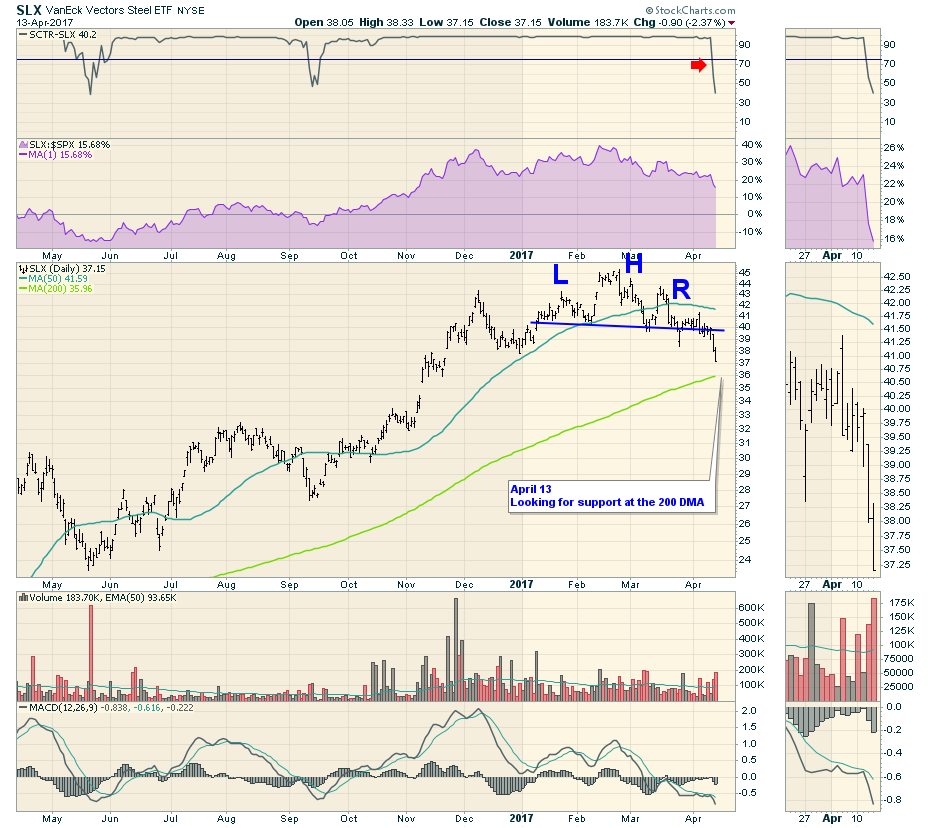 |
The Industrial Metals have been on everyone's radar recently. The daily and weekly charts are showing big cracks. Starting with the Steel ETF (SLX), this is on a train out of town. This contains a list of companies related to the Steel industry. Watch for a bounce at the 200 DMA and see if we get more than a bounce to the head/shoulders neckline in blue. Copper... |
|
|
|
|
|
|
by Tom Bowley
|
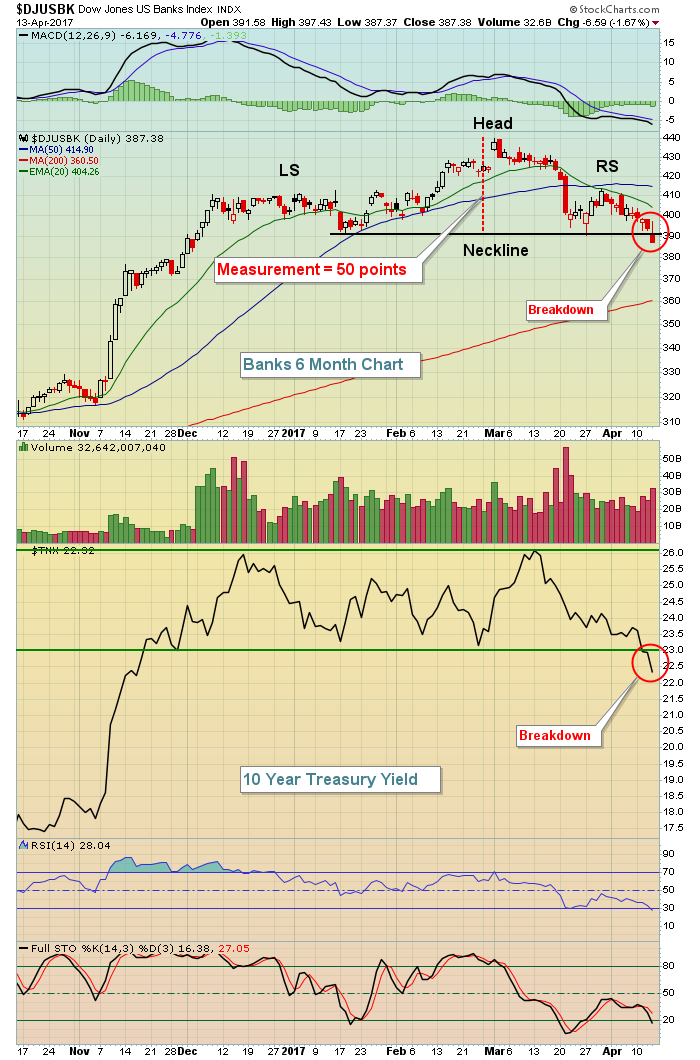 |
At the time of the last ChartWatchers article, I didn't really see a whole lot to be nervous about. However, the bullish picture certainly is getting a bit murkier based on developments since then. After a very strong ADP employment report on April 5th, most everyone was expecting a solid nonfarm payrolls report two days later. That never materialized, though, as the consensus... |
|
|
|
|
Bookstore Special
|
|
|
|
by John Hopkins
|
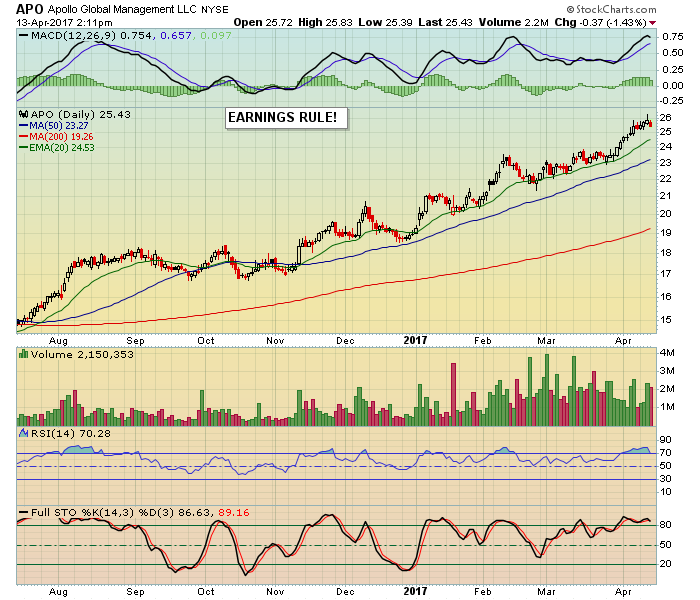 |
It's that time of the year, a time when all attention is turned to the bottom line of corporate America. It happens every quarter and it always has a major impact on the direction of the market. And the bottom line almost always trumps everything else. Of course there are other factors that impact the market including economic reports, geopolitical developments, Federal Reserve policies, as... |
|
|
|
|
|
|
by Erin Heim
|
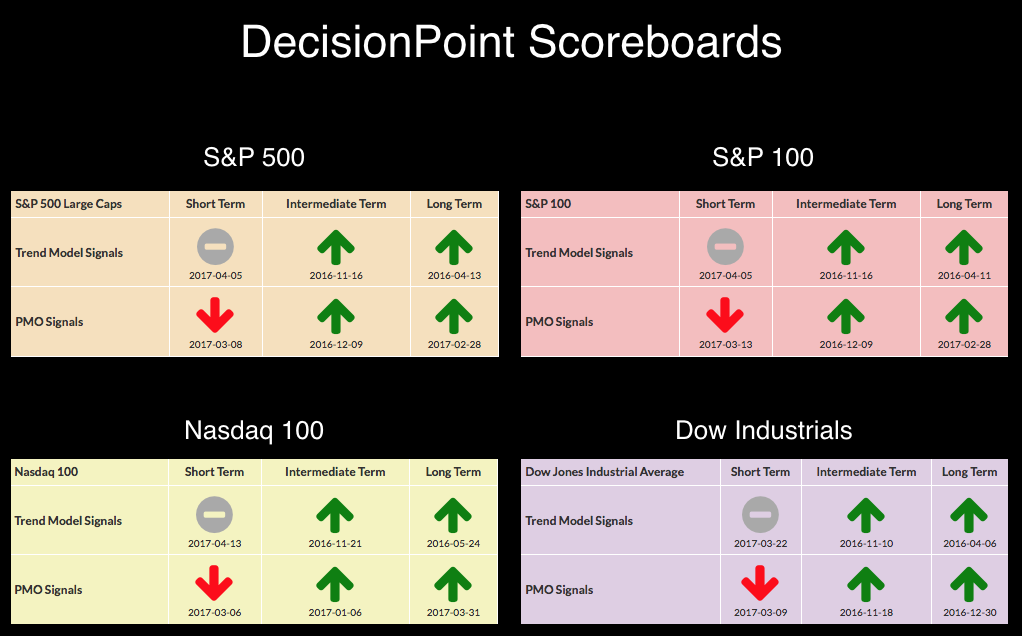 |
One look at the DP Scoreboards and it is apparent there are problems in the short term. It appears that the intermediate term is sitting comfortably on BUY signals. That is true for the IT |
|
|
|
|
|
|
by Gatis Roze
|
 |
Financial investment losses are the markets' way of telling you to make adjustments and to correct your present course of action. The parallels between how American investors deal with financial pain and how individuals deal with physical pain is illuminating. According to a recent article in Consumer Reports, 80% of Americans experience persistent pain of some type and spend over... |
|
|
|
|
|
|
|
|
|
Unlock All of Our
Tools and Features
- + Larger, Full-Screen Chart Sizes
- + Intraday Charts with Real-Time Data
- + Exclusive, Members-Only Commentary
- + Custom Technical Scans and Alerts
|
|
|
|
|
 |
|
|
|
ChartWatchers is our free, twice-monthly newsletter for online investors and StockCharts users. Whether you are brand new to charting or a seasoned analyst, each edition of ChartWatchers brings you insightful, expert commentary from the industry's leading technicians. See what's really happening in the markets through their eyes and gain an edge in your own investing.
|
|
|
|
|
|
| For more information about the ChartWatchers Newsletter or to subscribe for free, Click Here |
This email was sent to [email]. Need the newsletter sent to a different email address?
Simply unsubscribe your current email, then re-subscribe using the new address. |
| Click Here to instantly unsubscribe |