Another insightful issue of the ChartWachers Newsletter has arrived!

Expert Technical Commentary Delivered Straight To Your Inbox

April 7, 2018
StockCharts TV

WE'RE LIVE! (like...really live!)

Well folks, it was a big, big week here at StockCharts. This past Monday, we launched StockCharts TV, the first and only 24/7 video streaming channel devoted exclusively to financial charting, technical analysis and current market commentary from the web's top technical experts. With a constant stream of technical charting-focused content, including both live shows and pre-recorded video, StockCharts TV allows you to tune into a nonstop flow of insightful, educational, entertaining financial programming – 24 hours a day, 7 days a week.

Free to watch, the StockCharts TV channel can be accessed from any web-enabled device, whether you're at the office on a desktop computer, at home on your laptop, or on the go with a smartphone. We've even developed an official StockCharts TV app for iOS and Android devices. The app is available now for free on the App Store for iOS devices and on Google Play for Android devices.

New Live Shows Starting This Month!

StockCharts TV will feature multiple live shows during each week, all hosted by top technicians and market veterans. "MarketWatchers LIVE" will continue to be hosted daily by Tom Bowley and Erin Swenlin. It will remain in its current timeslot, airing from 12:00pm to 1:30pm ET, Monday through Friday.

In addition, Arthur Hill's new live show, "On Trend with Arthur Hill", kicks off this coming Tuesday, 4/10, at 10:30am ET. Arthur's show will air weekly on Tuesdays 10:30am ET.

The week after next, Greg Schnell will kick off his new live show, "The Final Bar", which airs on Thursdays at 5:00pm ET (starting on 4/19).

As the StockCharts TV channel continues to grow, we'll add more and more live shows by other charting experts and financial professionals. We will also continue to frequently host featured guests and bring you special presentations by a wide array of industry leaders. To stay up to date with the latest live show times and other segments throughout the week, be sure to keep an eye on the schedule at the bottom of the StockCharts TV page online.

Ready to check out StockCharts TV? Tune in now at StockCharts.com/tv!

Until next time,

Grayson Roze

Grayson Roze

StockCharts.com

Having trouble seeing this email? Click to view online

This Week's Articles

The Market Message

Third Tariff Threat Sinks Market

by John Murphy

Article Image

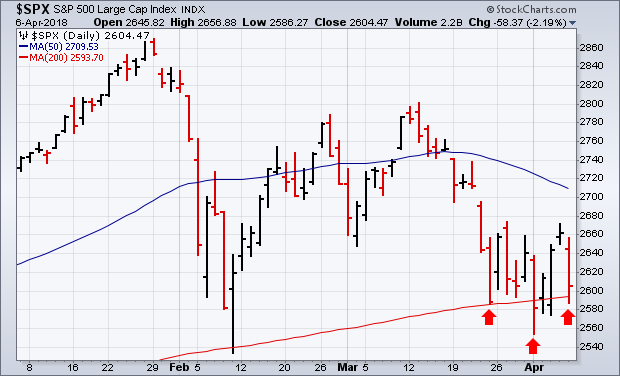
Just when it looked like the stock market was about to recover from the first two rounds of tariff threats, stocks were hit with a third and bigger $100 billion tariff threat after the close on Thursday. As a result, stock market indexes fell more than 2% on Friday with all market sectors in the red. That pushed all three major stock indexes back into the red for the week. Foreign stocks also...

Read Article

Art's Charts

The 800-pound Gorilla Continues to Struggle

by Arthur Hill

Article Image

The percentage of stocks above the 50-day EMA is a breadth indicator that measures internal performance. Chartists can compare this indicator across indexes to identify the leaders and laggards. The Nasdaq 100 is the weakest of the major indexes and weighing on the broader market. The chart below shows %Above 50-day EMA for the S&P 500, S&P Mid-Cap 400, S&P Small-Cap 600 and...

Read Article

The Canadian Technician

Rocky Indexes Frustrate Bulls And Bears

by Greg Schnell

Article Image

A wild week for the indexes concluded with a slam on Friday. As we head into earnings, we continue to see the market oscillate between the bulls and the bears. I continue to see a couple of nice things in the wild swings. The upcoming week should tell us which way this is going. Here is a two week view of the $SPX with 60-minute bars. If Friday is the low or near the low: We have a head...

Read Article

Trading Places

Identifying Solid Reward To Risk Trades For A Big Pre-Earnings Advance

by Tom Bowley

Article Image

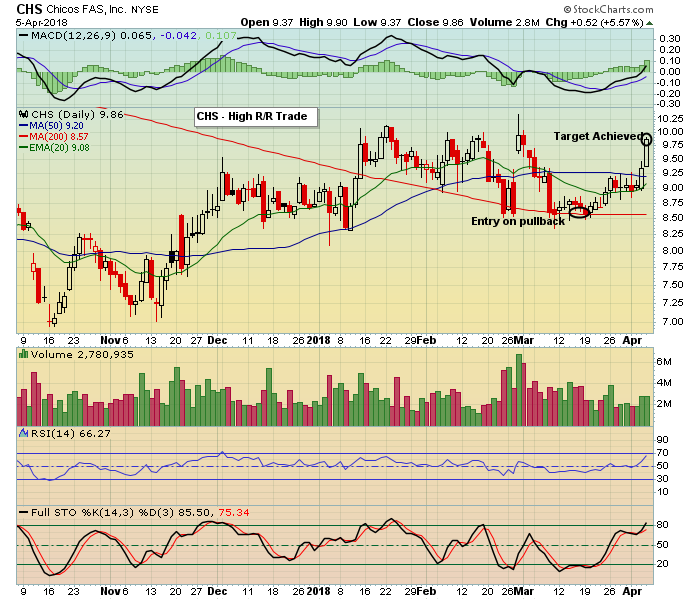
The start of every quarter represents a big opportunity to me and the reason is simple. Historically, the odds favor a bullish move into earnings season. Before we consider which individual stocks might be poised for a solid advance, let's take a look at history and the Volatility Index ($VIX). History is fact and indisputable. It doesn't guarantee future results, but it does...

Read Article

InvestEd Central

Making Money on Earnings Reports

by John Hopkins

Article Image

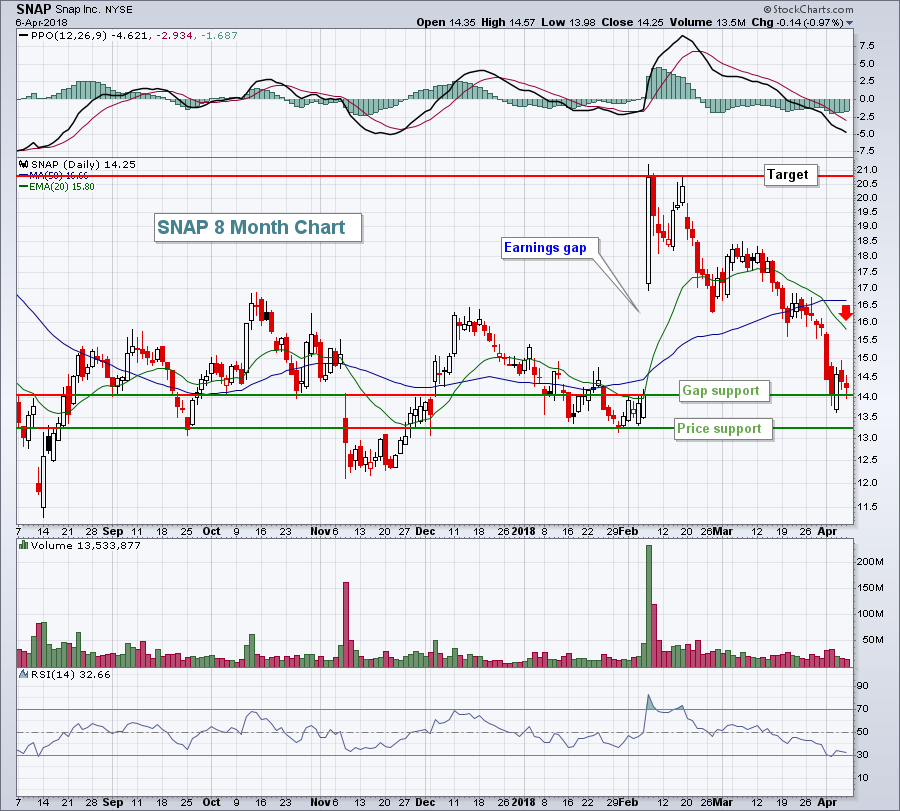
Earnings season is about to get underway with thousands of companies scheduled to report their Q1 numbers. It's an exciting time each quarter when companies are rewarded or punished depending on their results. It's always interesting to watch how traders react to a specific earnings report since there's really no way of telling what the reaction will be. For example, a company might beat...

Read Article

Bookstore Special

DecisionPoint

Defensive Sectors Performing - Utilities Only IT Trend Model BUY Signal

by Erin Swenlin

Article Image

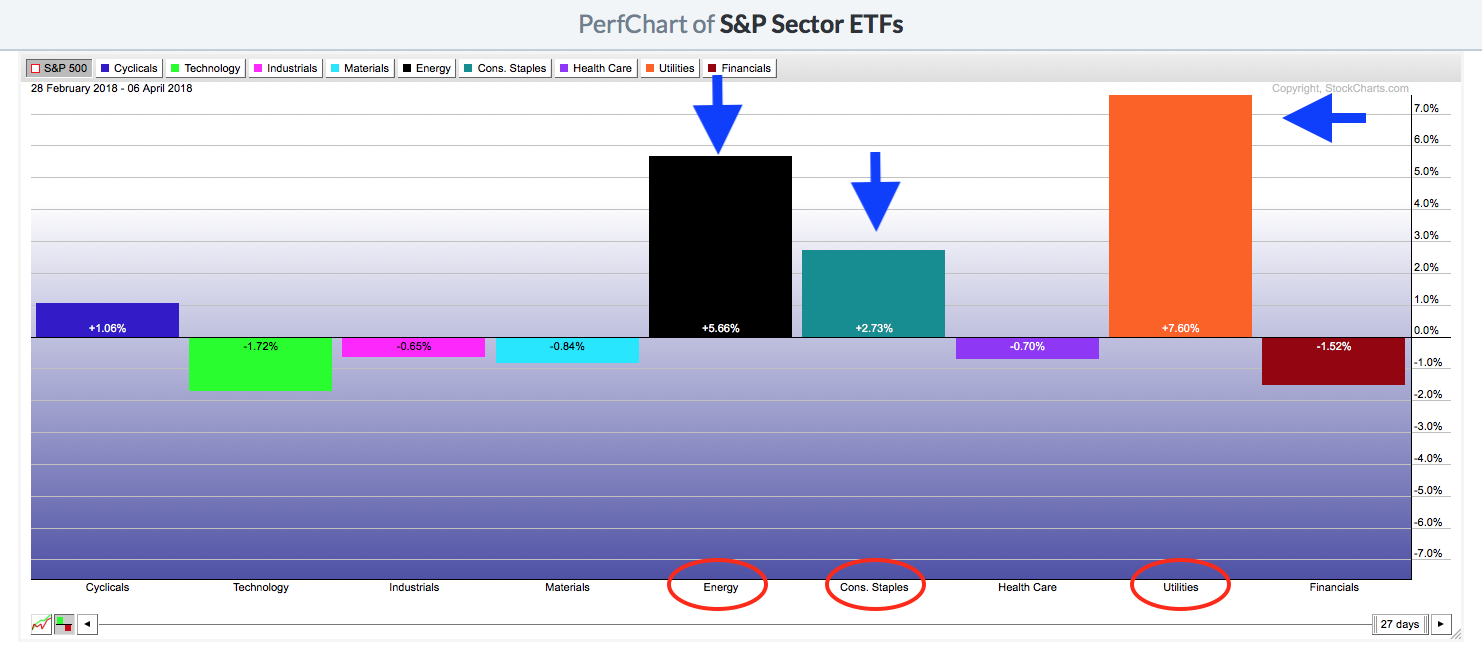
If you've been reading the DecisionPoint Blog lately or watching the MarketWatchers LIVE show on StockCharts TV, you know that I have been expressing concern over the sector rotation over the past few weeks and month. Over the past month, the worst performer is the Technology sector, followed by Financials which also took a hit. The highest performers by far have come in the more defensive

Read Article

See More Articles …

Become a Member

Become a Member

Unlock All of Our
Tools and Features

  • + Larger, Full-Screen Chart Sizes
  • + Intraday Charts with Real-Time Data
  • + Exclusive, Members-Only Commentary
  • + Custom Technical Scans and Alerts
Free 1-Month Trial
Visit ChartSchool

About ChartWatchers

ChartWatchers is our free, twice-monthly newsletter for online investors and StockCharts users. Whether you are brand new to charting or a seasoned analyst, each edition of ChartWatchers brings you insightful, expert commentary from the industry's leading technicians. See what's really happening in the markets through their eyes and gain an edge in your own investing.

f t
For more information about the ChartWatchers Newsletter or to subscribe for free, Click Here
This email was sent to [email]. Need the newsletter sent to a different email address?
Simply unsubscribe your current email, then re-subscribe using the new address.
Click Here to instantly unsubscribe