 MarketWatchers LIVE kicked off today at noon EST! Tom Bowley and I host this new webcast Monday, Wednesday and Friday from 12:00p - 1:30p EST. Very soon we will have a public ChartList available for the show as well as a MarketWatchers LIVE blog that will recap some of the important charts and topics discussed that day. Right now we don't quite have the collaborative ability to put detailed recaps together, but we soon will. Be sure and follow our new Twitter feed @MktWatchersLIVE and feel free to leave your comments, symbol requests etc. This will be THE place to interact with the show live, contribute to polls, etc. The Facebook page is nearly ready for prime time so look for the MarketWatchers LIVE Facebook page in the coming week.
DecisionPoint's indicator charts made quite a splash today on the show. While the trading day was a bit rocky, interestingly the Friday indicators were looking bullish in all time frames. I'm seeing some slight deterioration on some of these after today's decline, but nothing overly concerning...yet.
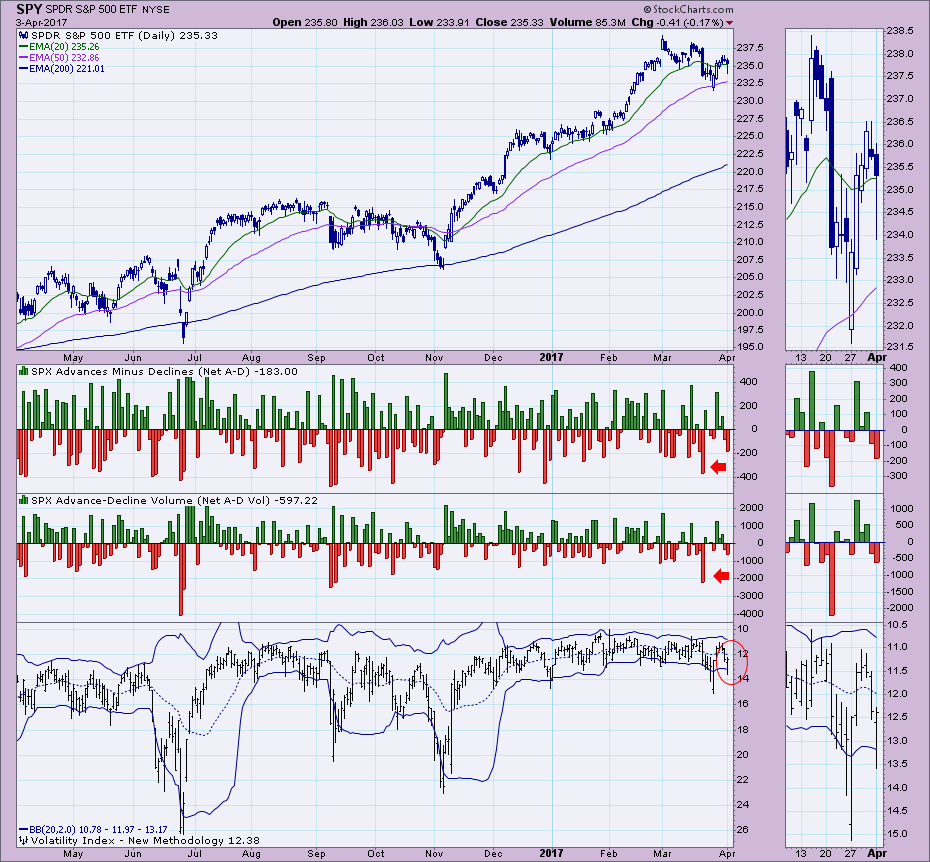
The ultra-short time frame is in hours to a day or two. I think these indicators are great for identifying climactic-type behavior. Meaning, we are looking for large spikes (like we saw last week) or penetrations of the upper or lower Bollinger Bands. Looking at today's indicators, I don't see any climactic behavior on net advances-declines, but I do see a sizable penetration of the lower band by the VIX. Typically, these penetrations lead to price reversals. In this case, on a reverse scale VIX, a lower band break gives us the expectation of a rally pop. I call them "pops" because in the ultra-short-term timeframe, that's about the most we can expect from signals on these indicators. We can see a trend develop out of these reversals, but not all the time.
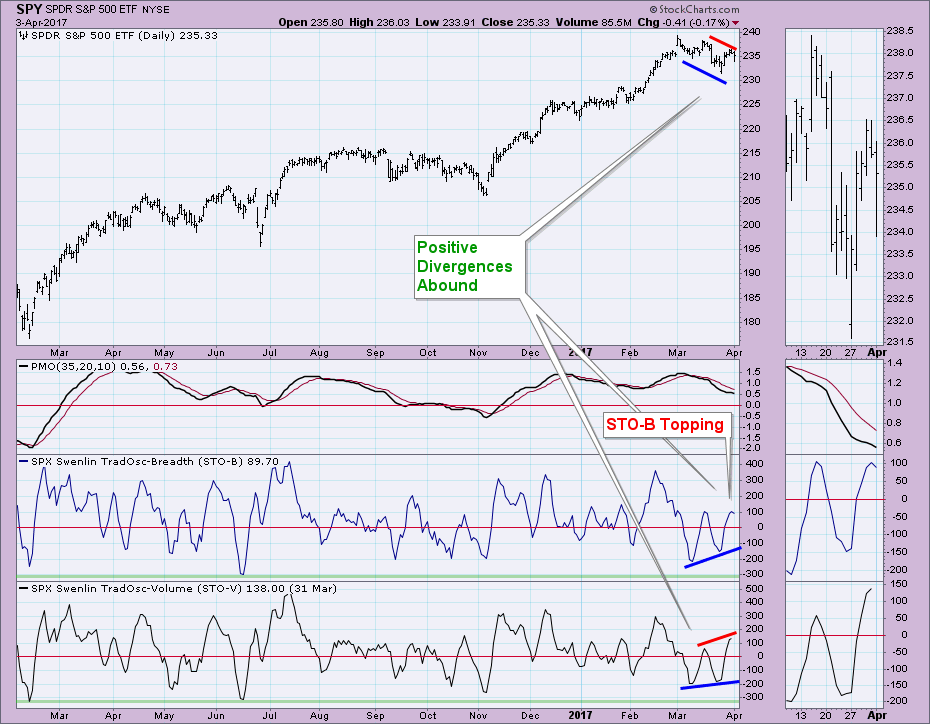
Our short-term indicators still look very bullish. There is a problem with the Swenlin Trading Oscillator - Breadth (STO-B) turning down. However, I'm not so sure it will stick. With so many positive divergences on this chart, I have to lean bullish in the short term.
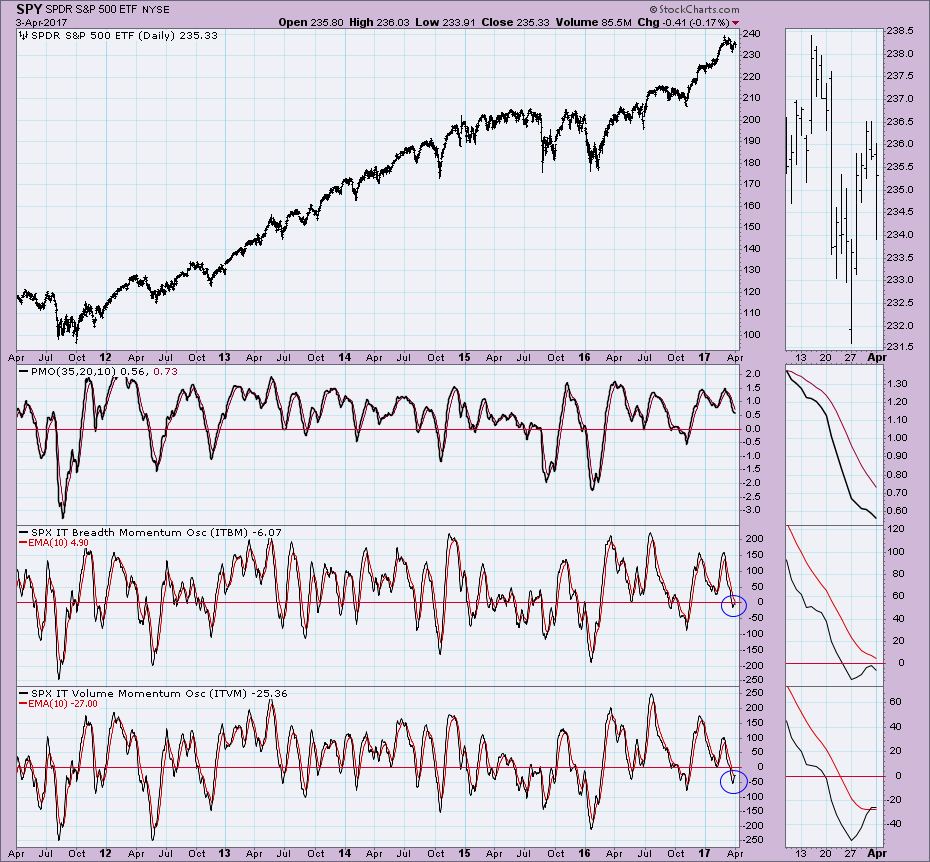
Intermediate-term indicators had just seen the Intermediate-Term Volume Momentum (ITVM) have a positive crossover its signal line. Unfortunately, it flattened, but more concerning would be the top below the signal line on the Intermediate-Term Breadth Momentum (ITBM). I'm not ready to throw in the towel here, we see many twitches and wiggles on these indicators and this could turn out to be just that.
Conclusion: When Tom and I finished the show we gave our "outlooks" in the various timeframes. Tom and I were bullish in all timeframes, but I think I agree with Tom that we should be more "cautiously" optimistic in the intermediate term. That jibes with what we are seeing on the DP intermediate-term indicators.
The DecisionPoint LIVE Shared ChartList is available now! Click on the link and you'll find all your favorite DP charts all annotated! Be sure and bookmark it!
Technical Analysis is a windsock, not a crystal ball.
Happy Charting!
- Erin