 There were only three results on today's Diamond Scan, but I actually decided that all three passed muster. I ran a few other scans and Microsoft ("Mr. Softy" as Tom Bowley used to call it on MarketWatchers) made an appearance. I took a look at the charts and I decided it also passed muster. The other one I found using my Bullish EMA - Mid-Range SCTR scan. I would like to caveat today's Diamonds Report with this: If the overall market trend remains up, the outcomes on any purchase of stock will be improved. As it stands now, we have hit new all-time highs, but overall the market has been in a choppy trading range since the end of June. This is the main reason I haven't been adding to my positions.
I love to get your feedback on these reports, so shoot me an email at erinh@stockcharts.com. I read every one of them!
Welcome to "DecisionPoint Daily Diamonds," a newsletter in which I highlight five "diamonds in the rough" taken from the results of one of my DecisionPoint scans. Remember, these are not recommendations to buy or sell, but simply stocks that I found interesting. The objective is to save you the work of the initial, tedious culling process, but you need to apply your own analysis to see if these stocks pique your interest as well. There are no guaranteed winners here!
Current Market Outlook:
Market Trend: Currently, we have Trend Model BUY signals in all three timeframes on the DP Scoreboard Indexes.
Market Condition: The market is overbought and we have Price Momentum Oscillator (PMO) BUY signals on the DP Scoreboards. Caution is still warranted as volume and breadth are not confirming these new all-time highs.
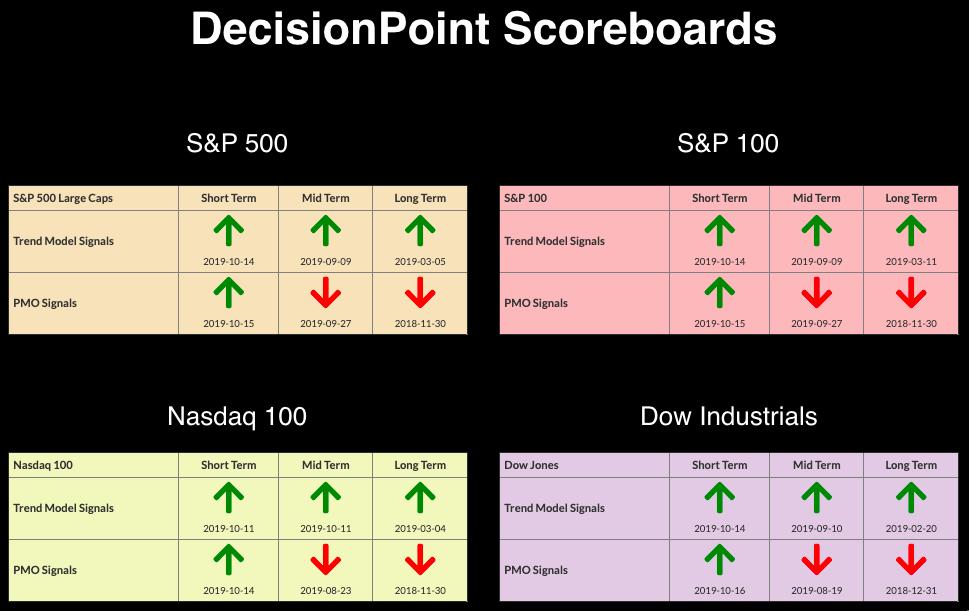
Market Environment: It is important to consider the odds for success. Here are the current percentages on the Silver and Golden Cross Indexes:
- Silver Cross Index: 61.6% SPX IT Trend Model Buy Signals (20-EMA > 50-EMA)
- Golden Cross Index: 68.4% SPX LT Trend Model Buy Signals (50-EMA > 200-EMA)
Diamond Index:
- Diamond Scan Results: 3
- Diamond Dog Scan Results: 17
- Diamond Bull/Bear Ratio: 0.18
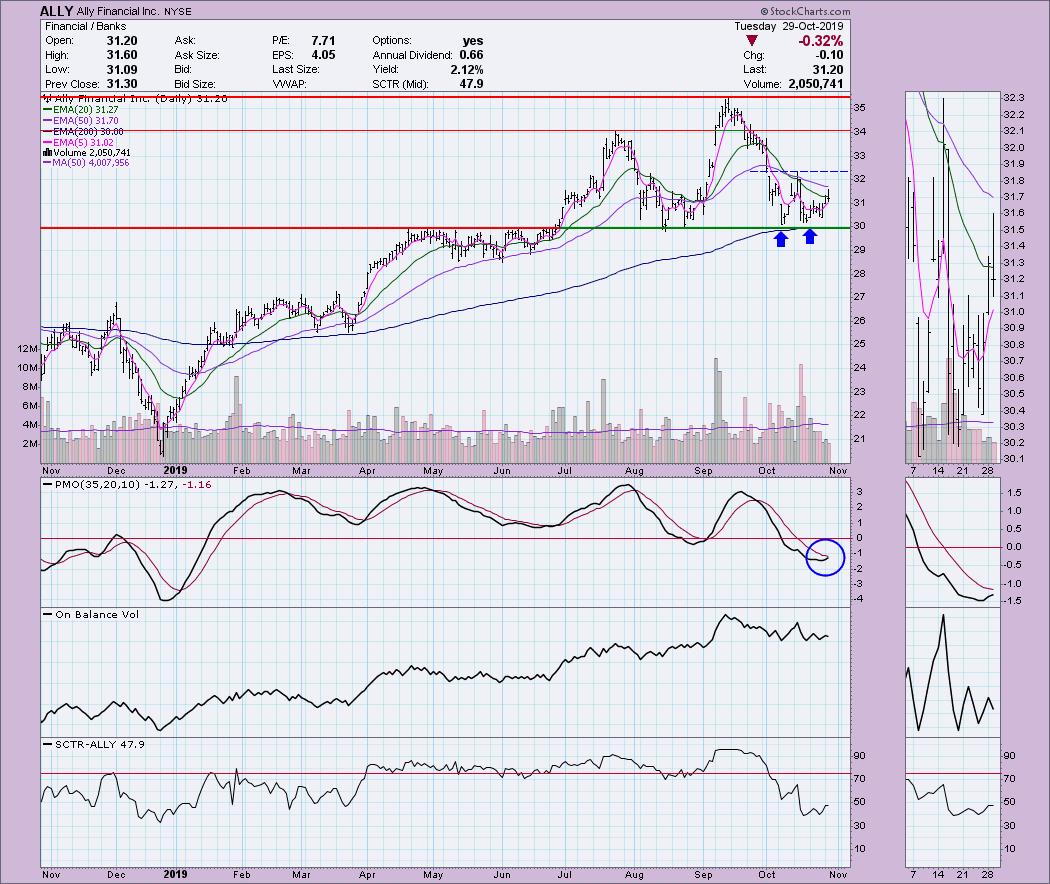
Ally Financial Inc (ALLY) - Earnings: 1/28 - 2/3/2020
I can see a double-bottom pattern trying to form. It could be called an "Adam and Eve" double-bottom if you want to get more technical (or chuckle). The expectation is a breakout above the confirmation line, which seems entirely possible with a PMO that is rising for a crossover BUY signal. I do note that, back around 10/14, the PMO hooked upward but reversed back down. However, in this case, it appears the PMO has been rising for more than one day. After breaking out above the 20-EMA, it has closed beneath it today. A pullback after a breakout is generally a good entry point.
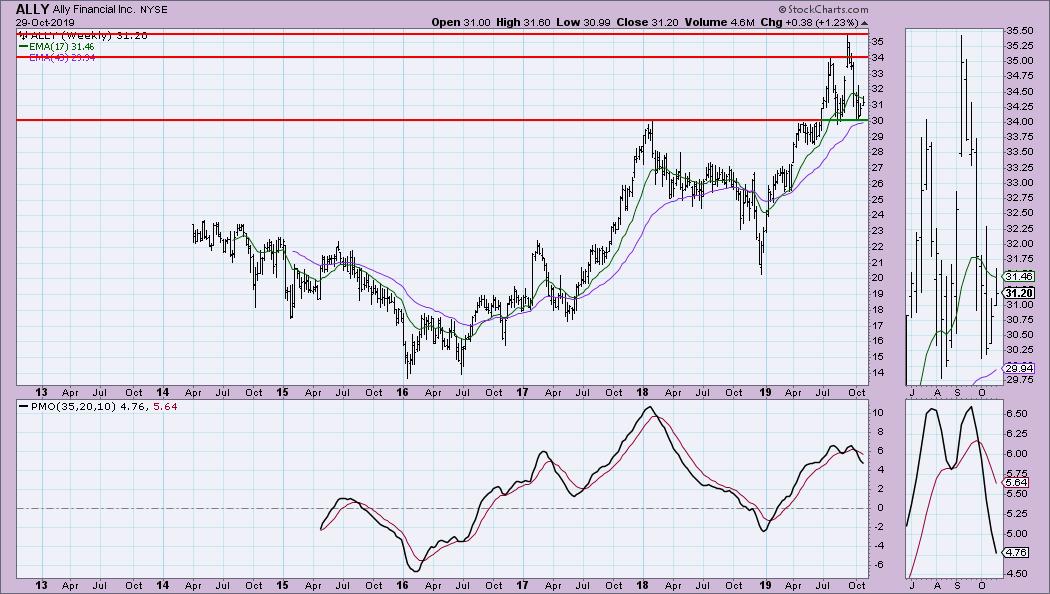
The weekly PMO doesn't look too good, but we can see that $30 has been a solid area of support and previous resistance. This could be a nice area for a bounce and a move toward $34-$35.
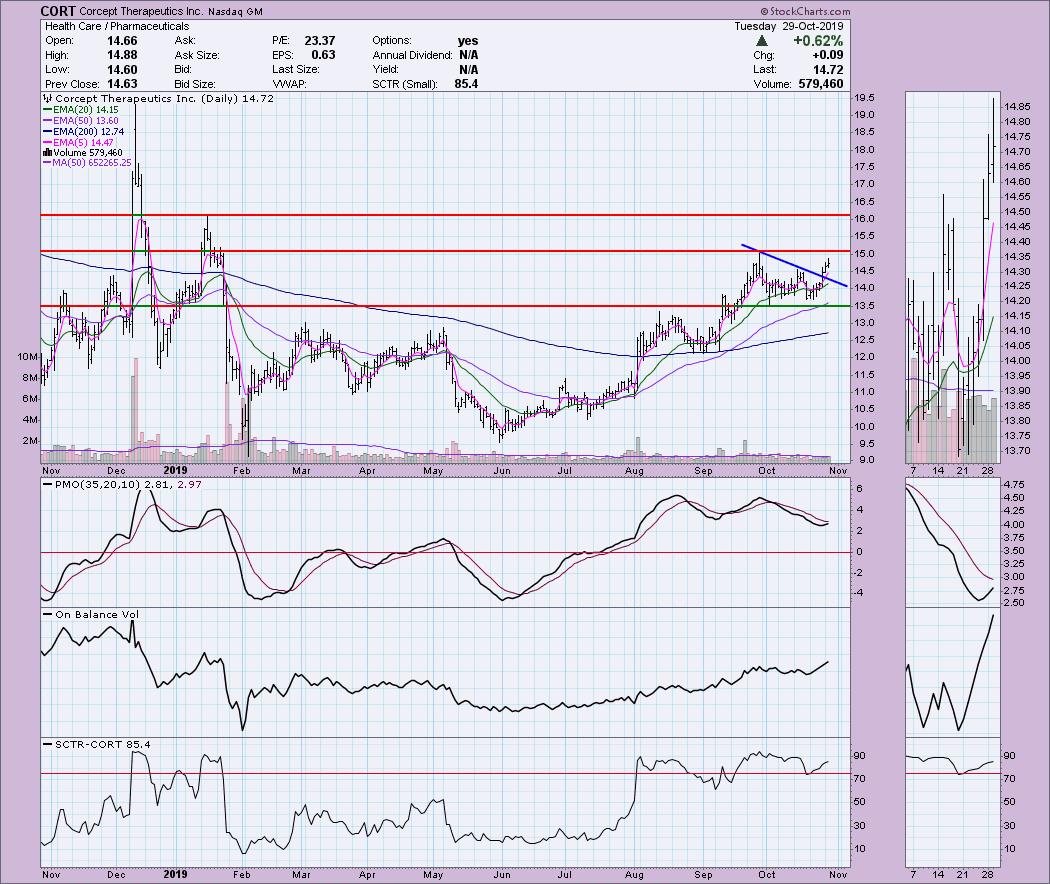
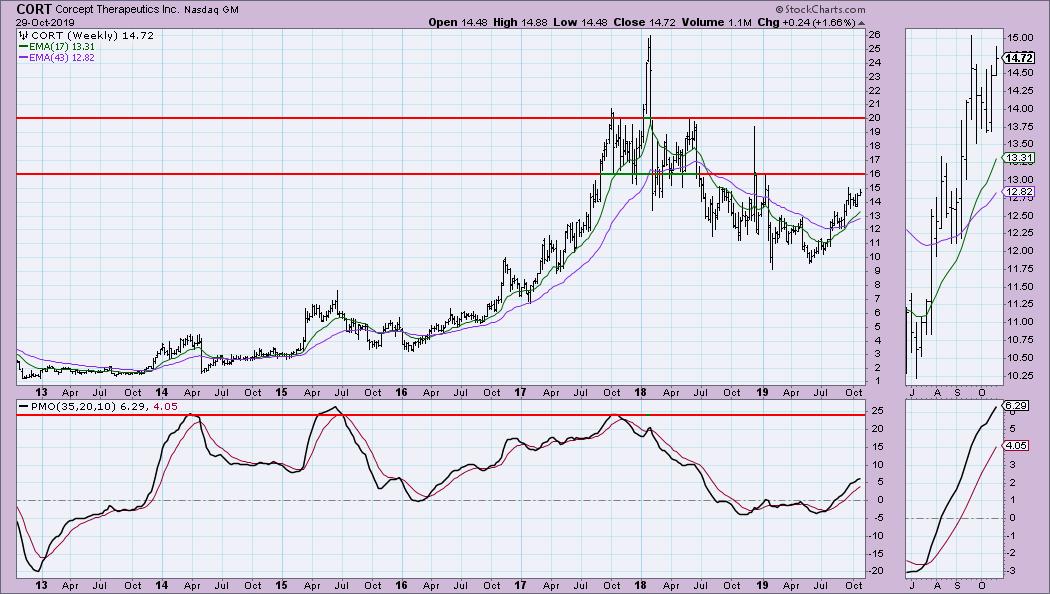
Corcept Therapeutics Inc (CORT) - Earnings: 10/30 - 11/4/2019
This is a nice breakout from a short-term declining trend. The PMO looks good and I note that, when it does have crossovers, they are "clean," meaning very little twitch or whipsaw. The OBV is breaking out, just as price is. The SCTR is healthy and in the "hot zone" above 75.
The weekly PMO is rising nicely. The 17-week EMA just crossed above the 43-week EMA, which is also a good sign. My main concern is that $16 could prove to be difficult overhead resistance to overcome. However, that would still represent a healthy gain.
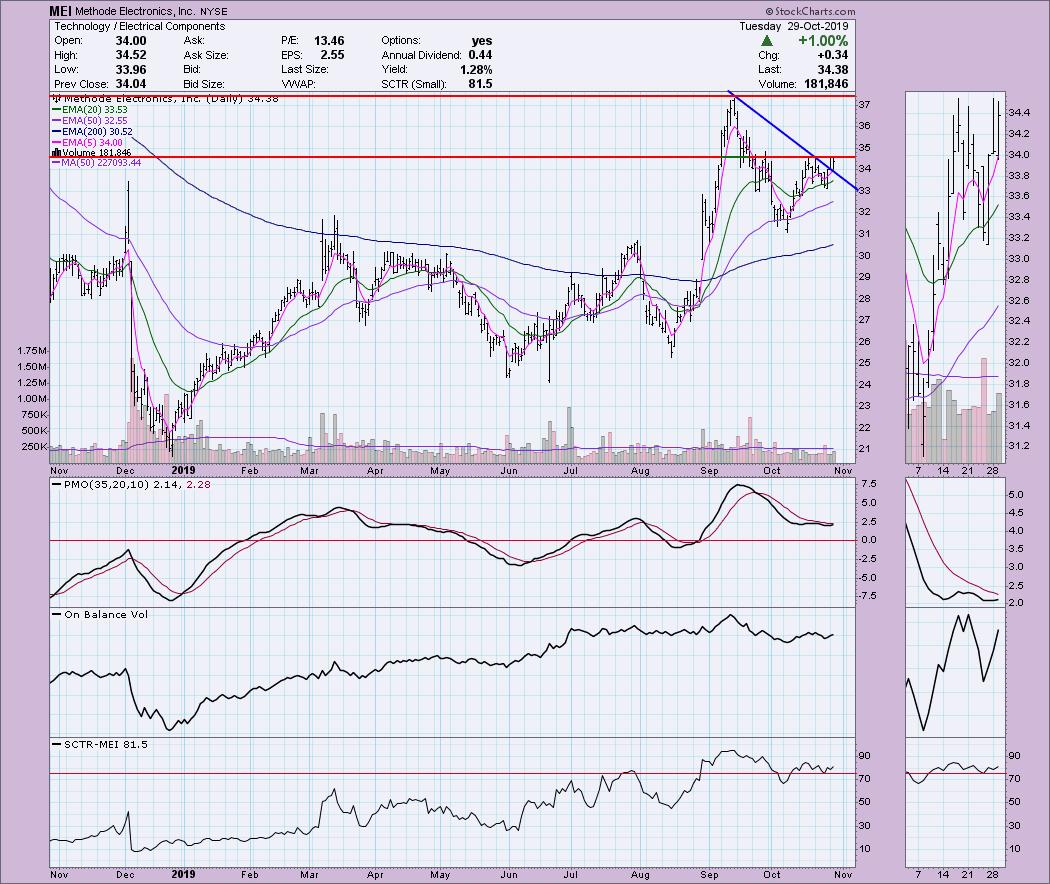
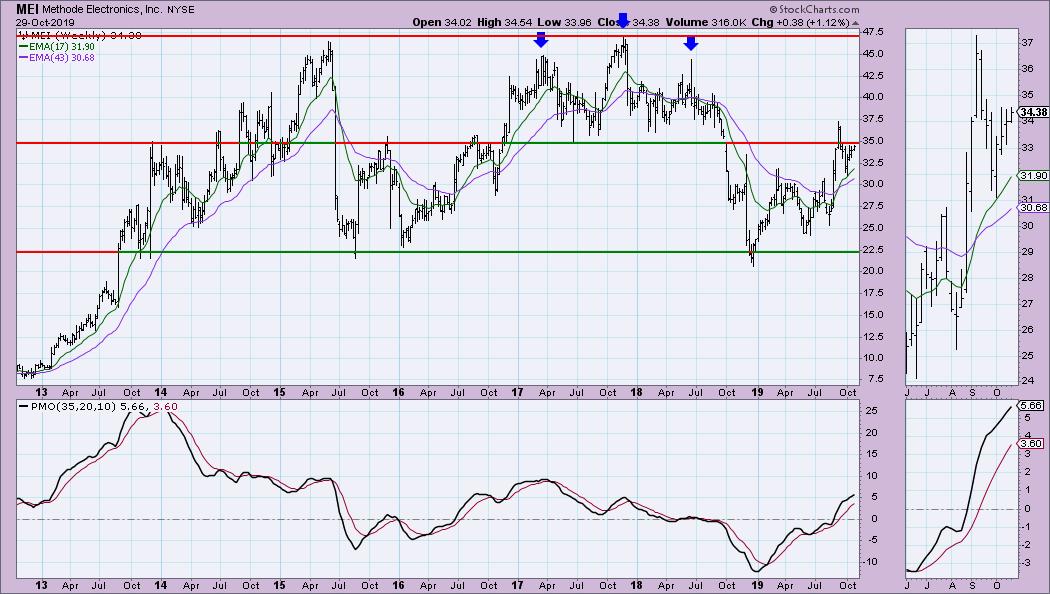
Methode Electronics Inc (MEI) - Earnings: 12/4 - 12/9/2019
The declining trend was broken, but MEI is butting up against short-term overhead resistance. The PMO isn't showing much excitement yet, but it is technically rising and has remained above zero even during the deep decline in September. The SCTR is healthy and we are seeing rising bottoms on the OBV. Check and check.
The $35 overhead resistance is more worrisome on the weekly chart, as we can see it was the neckline of a head-and-shoulders. Given the bullish weekly PMO, I'm looking for a breakout here. I point out the head-and-shoulders as it was textbook. After it broke down below the neckline, it resolved almost to the dollar at the minimum downside target, which is calculated by taking the height of the pattern and subtracting it from the neckline.
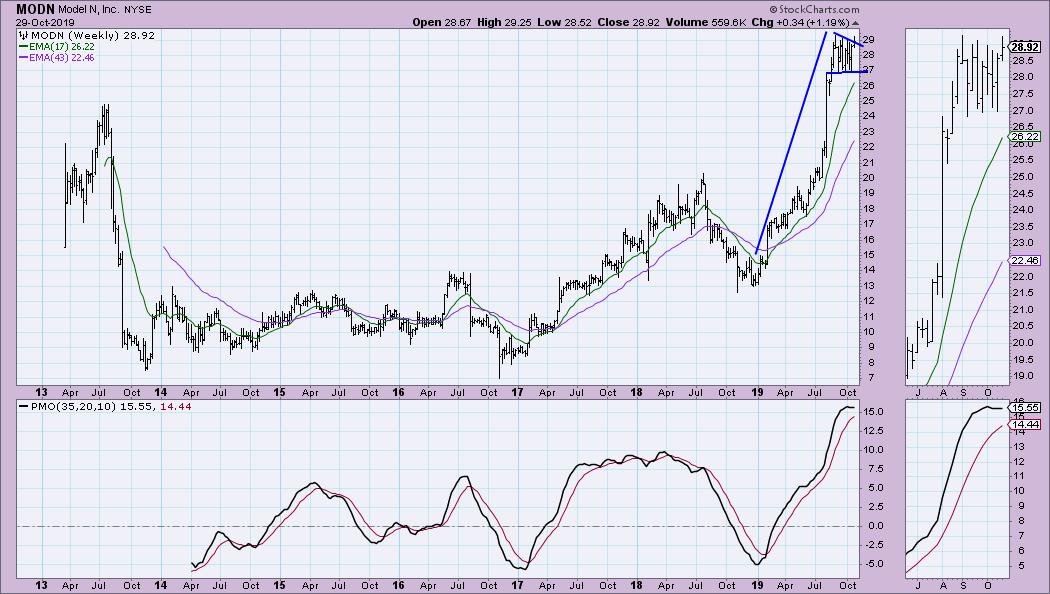
Model N Inc (MODN) - Earnings: 11/5/2019
Full disclosure, I do own this stock and have since early May. It's always nice to be able to share a success story, but my portfolio does tell the tale that not all of my investments have such happy endings. I've been debating closing out part of my position but, when I found this one on my Diamond Scan today, it was clear that it is a continued hold. The PMO has turned up and we got a bullish conclusion to a bearish descending triangle formation. Note that the OBV bottoms have been trending higher while price lows have been mostly flat. The SCTR is fantastic with a 96.3 ranking.
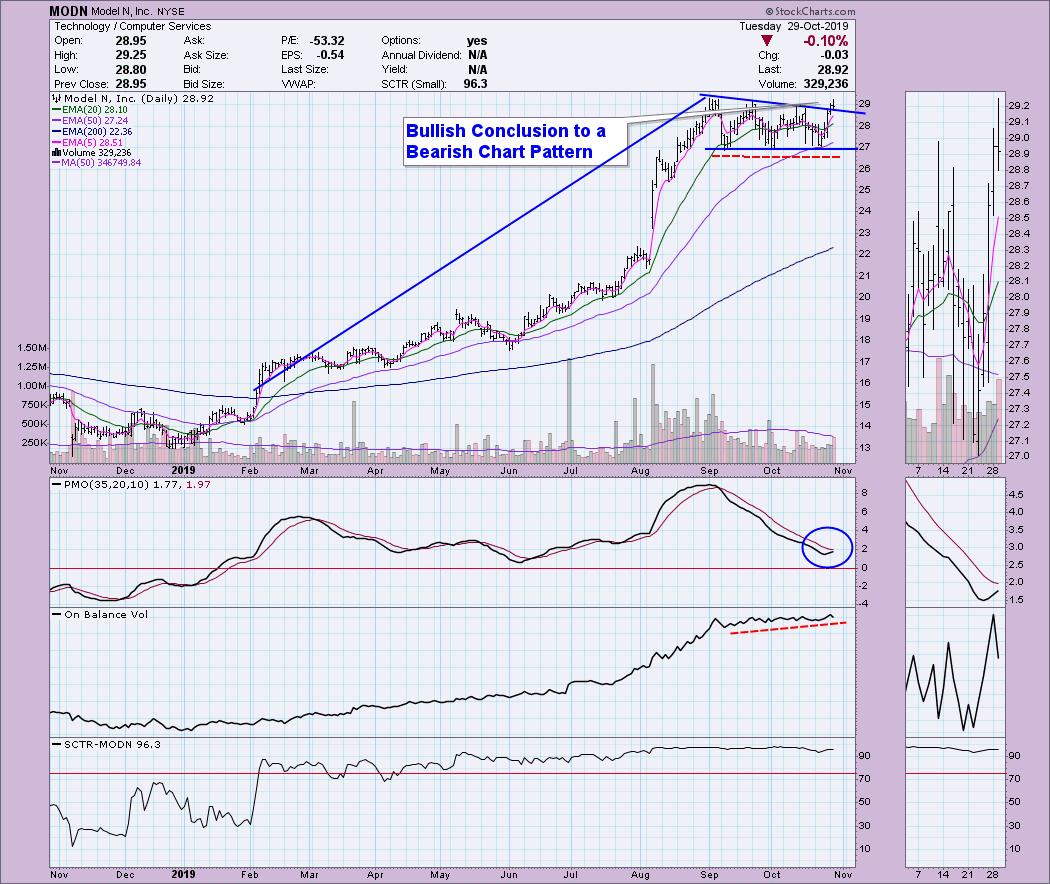
Granted, the PMO is in very overbought territory, but the giant flag formation on this chart is enticing. We don't have a negative crossover on the PMO yet either. I'll be keeping an eye out, but at this point my stop is set at $26.
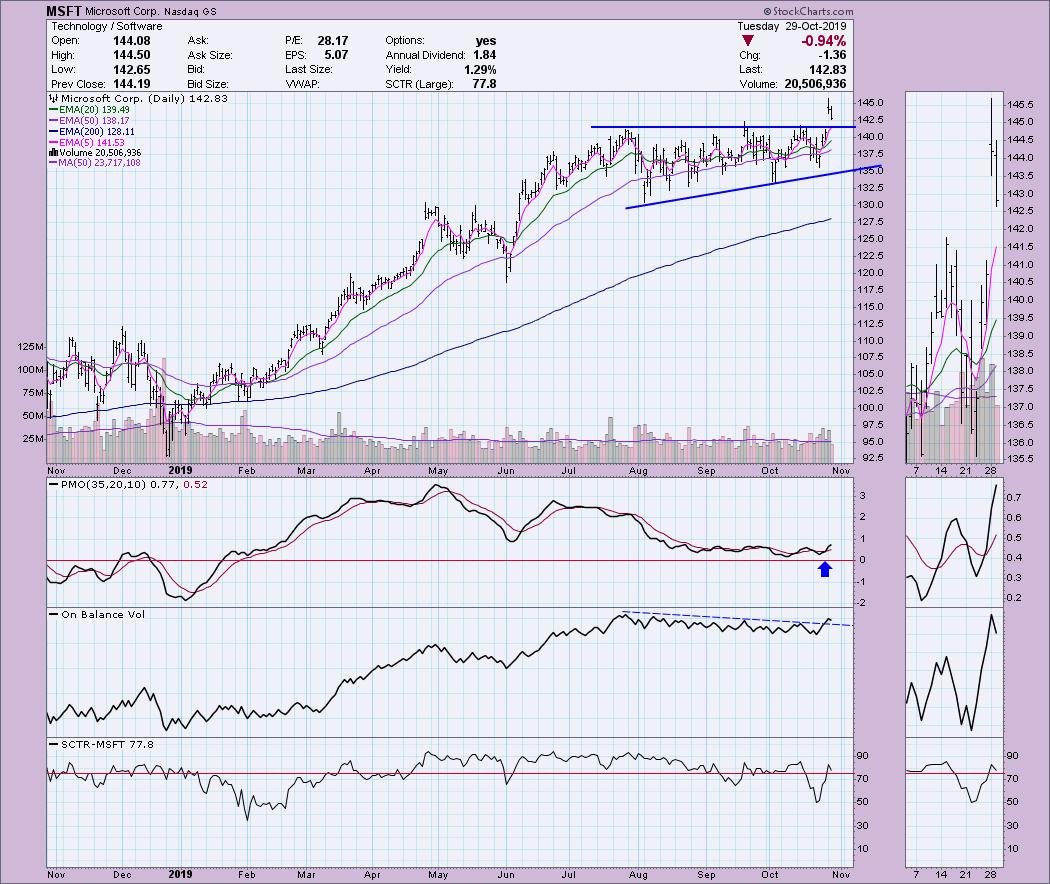
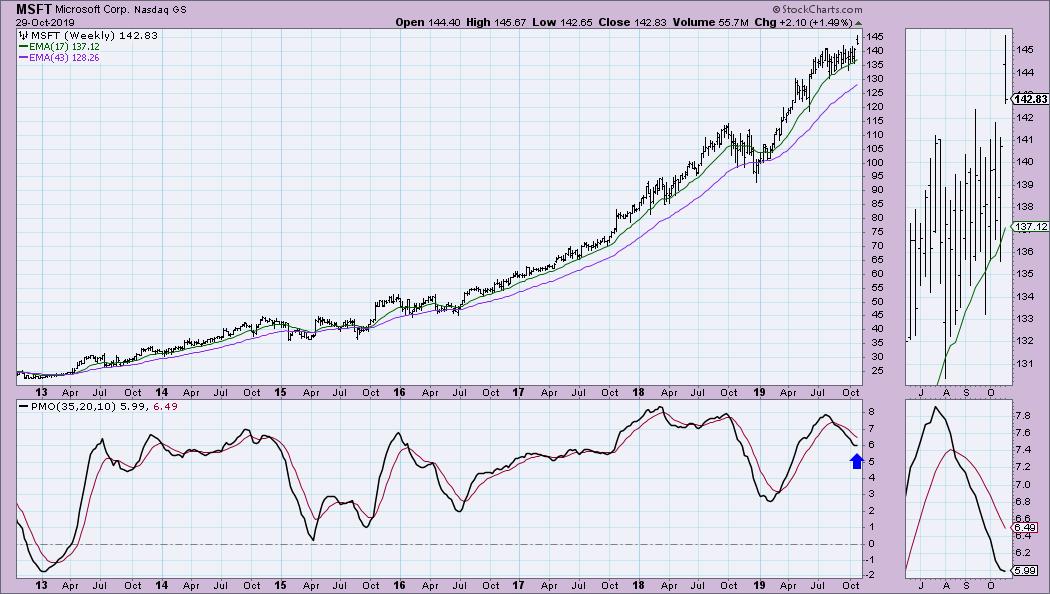
Microsoft Corp (MSFT) - Earnings: 1/28 - 2/3/2020
Let me start with my problem with MSFT - it leads the market indexes based on capitalization. Consequently, if I'm bearish on the broad market, or suspicious like I am now, I worry. That aside, the breakout was great and today's pullback toward the breakout point is what I look for. The ascending triangle executed on that breakout and, based on the measurement of the back of the pattern, the minimum upside target would be around $154. I like how, on today's pullback, the volume was somewhat light. The OBV is now breaking its declining trend and the PMO is about to move above near-term tops.
The weekly PMO has been in decline, but price didn't break down. The PMO is now beginning to turn up on this breakout.
Full Disclosure: I currently own MODN and plan to continue holding it. My stop is at $26 currently. I don't own any of the others and don't plan on adding any to my portfolio at this time. I'm being patient as I don't trust this market. I'm currently about 60% in cash.

SAVE THE DATE!!
Erin Swenlin will be presenting at the TradersExpo in New York City on March 15-17, 2020! You'll have an opportunity to meet Erin and discuss the latest DecisionPoint news and Diamond Scans. The conference is free to attend or view online!
Watch the latest episode of DecisionPoint with Carl & Erin Swenlin LIVE on Mondays 5:00p EST or on the StockCharts TV YouTube channel here!
Technical Analysis is a windsock, not a crystal ball.
Happy Charting!
- Erin
erinh@stockcharts.com
NOTE: The stocks reported herein are from mechanical trading model scans that are based upon moving average relationships, momentum and volume. DecisionPoint analysis is then applied to get five selections from the scans. The selections given should prompt readers to do a chart review using their own analysis process. This letter is not a call for a specific action to buy, sell or short any of the stocks provided. There are NO sure things or guaranteed returns on the daily selection of "diamonds in the rough."
Helpful DecisionPoint Links:
DecisionPoint Shared ChartList and DecisionPoint Chart Gallery
Price Momentum Oscillator (PMO)
Swenlin Trading Oscillators (STO-B and STO-V)
**Don't miss DecisionPoint Commentary! Add your email below to be notified of new updates"**