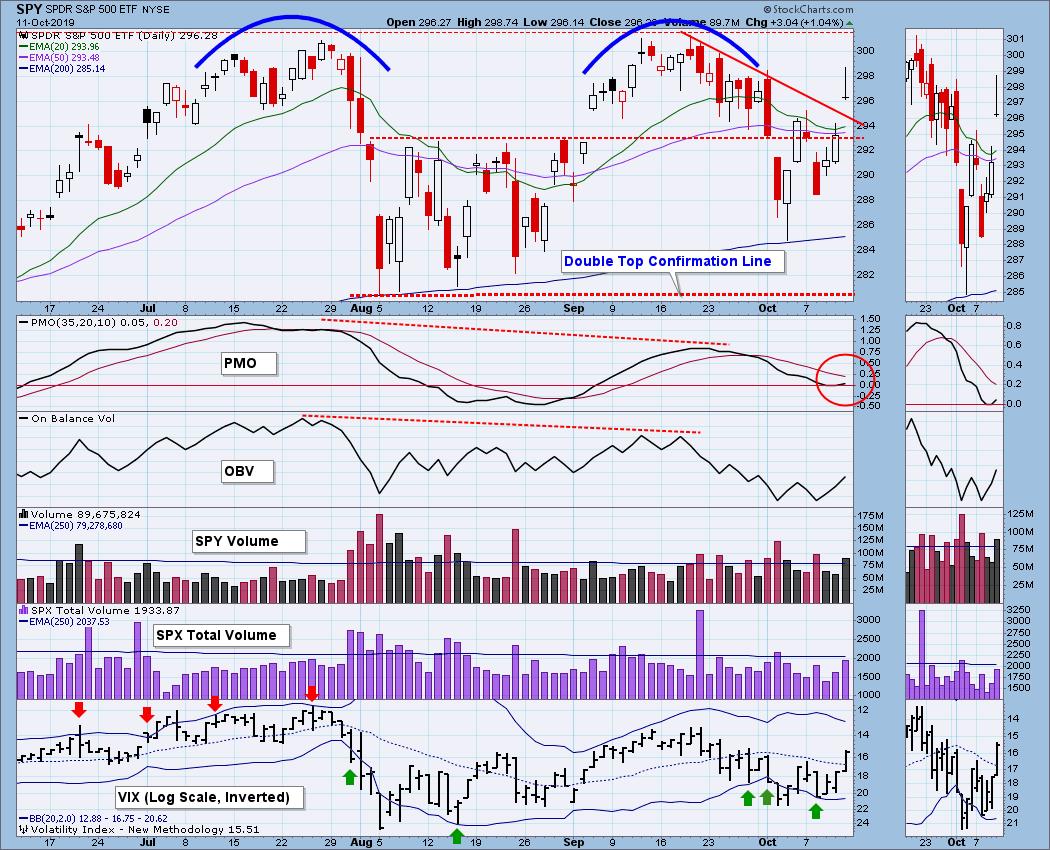
Last week I said, "There is a declining trend line drawn from the mid-September top. If that is taken out, I will pretty much give up on the double top idea." When I wrote that, I had in mind a solid, deliberate advance to new, all-time highs. What we got on Friday was an up gap induced by positive news on the trade deal with China, but the news story wasn't fleshed out until after the close, so we'll have to see how a more informed market responds on Monday. A couple of things, Friday's candlestick looks like a bearish shooting star, and SPX Total Volume was a bit light, considering the size of the move. Let's look at the rest of the charts.
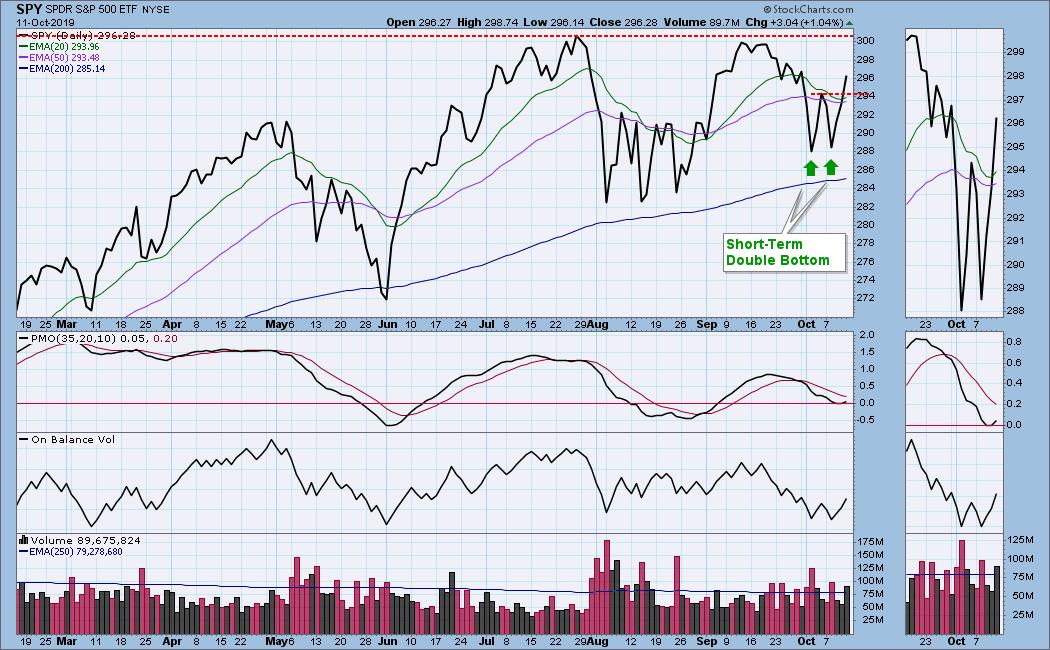
Sometimes it helps to look at a line chart for clarification because it ignores the intraday gyrations and focuses only on closing prices. In this case we can see a short-term double bottom, and the minimum upside target would put price in the vicinity of record highs.
The DecisionPoint Weekly Wrap presents an end-of-week assessment of the trend and condition of the stock market (S&P 500), the U.S. Dollar, Gold, Crude Oil, and Bonds.
Watch the latest episode of DecisionPoint on StockCharts TV's YouTube channel here!
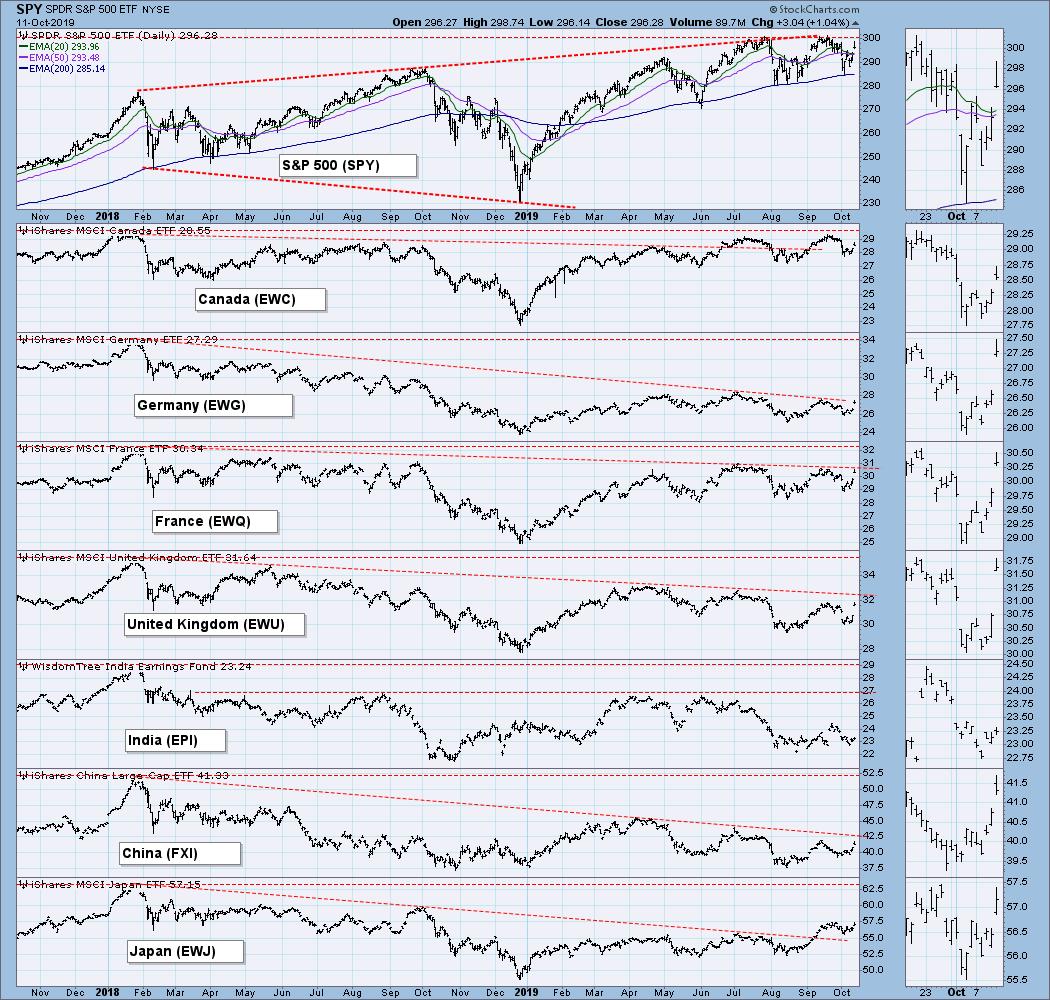
GLOBAL MARKETS
Trade deal news was out early, and most world markets responded.
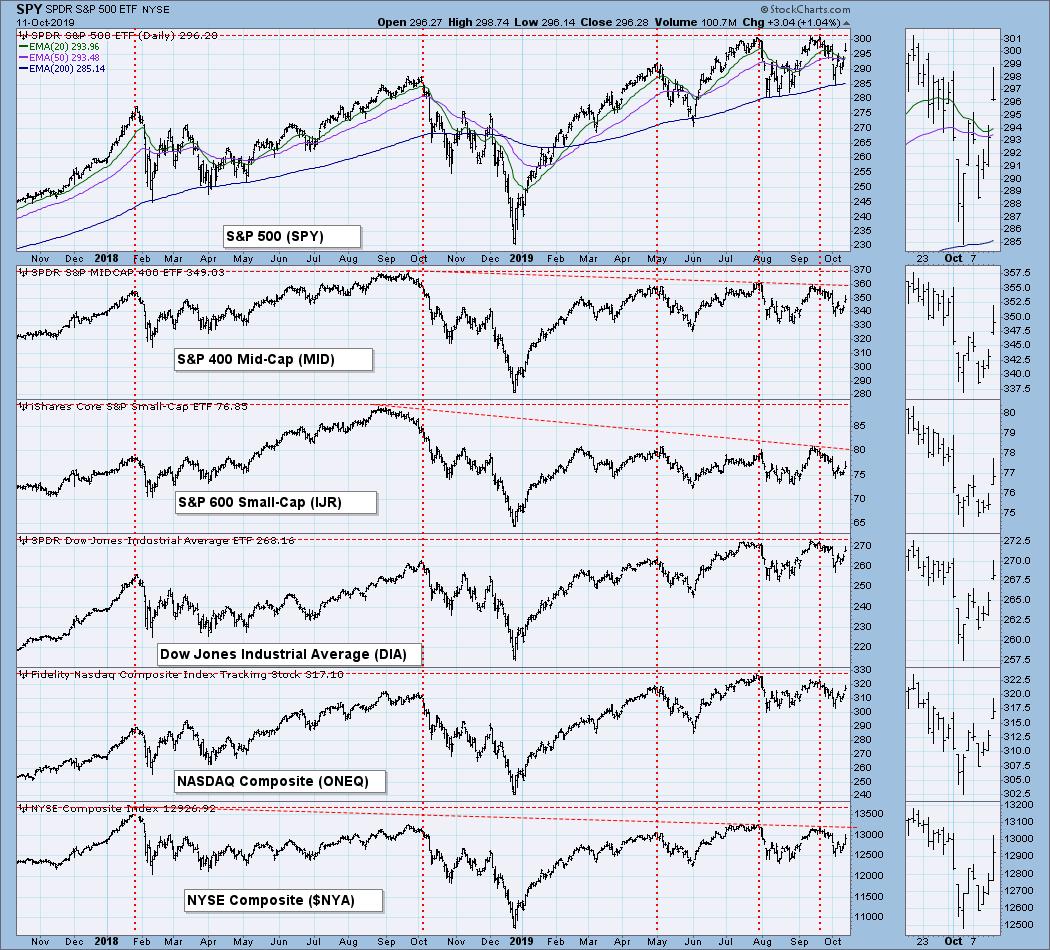
BROAD MARKET INDEXES
Large-cap indexes still lead.
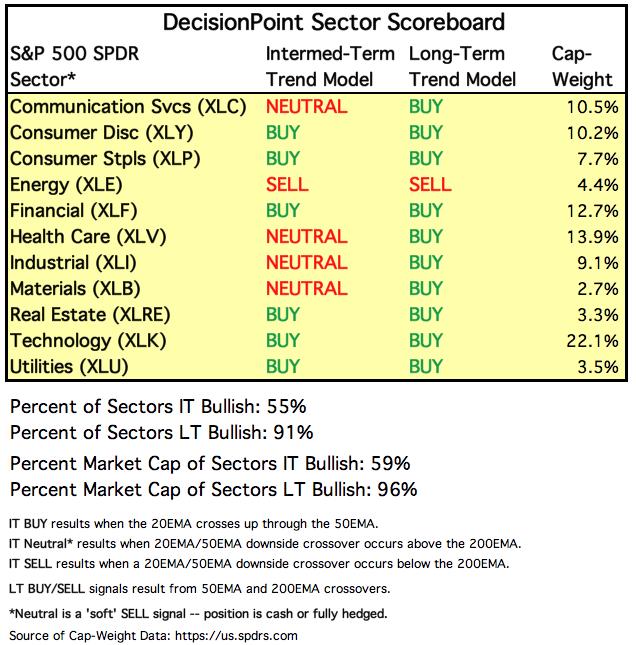
SECTORS
Each S&P 500 Index component stock is assigned to one, and only one, of 11 major sectors. This is a snapshot of the Intermediate-Term and Long-Term Trend Model signal status for those sectors.
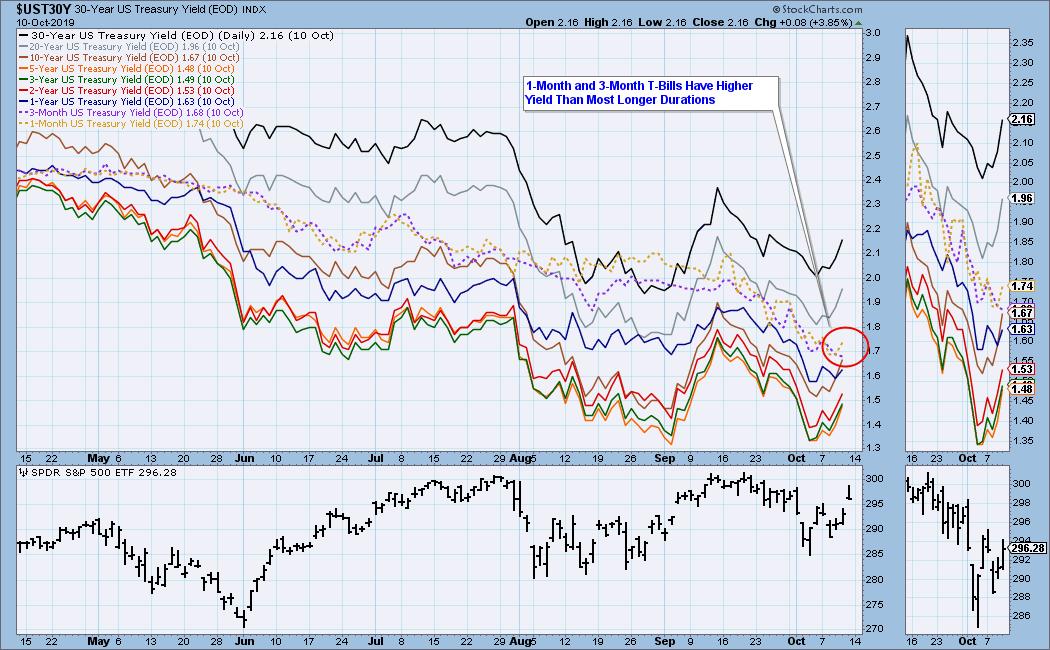
INTEREST RATES
Because some interest rates are currently inverted, I will be including a chart so we can monitor the situation. In normal circumstances the longer money is borrowed the higher the interest rate that must be paid. When rates are inverted, the reverse is true. It is generally believed that rate inversions result from "a flight to safety." On the chart below, notice that the one-month and three month T-Bills (dotted lines) pay a higher interest rate than the one year through the 10-year T-Bonds.
STOCKS
IT Trend Model: NEUTRAL as of 9/6/2019
LT Trend Model: BUY as of 2/26/2019
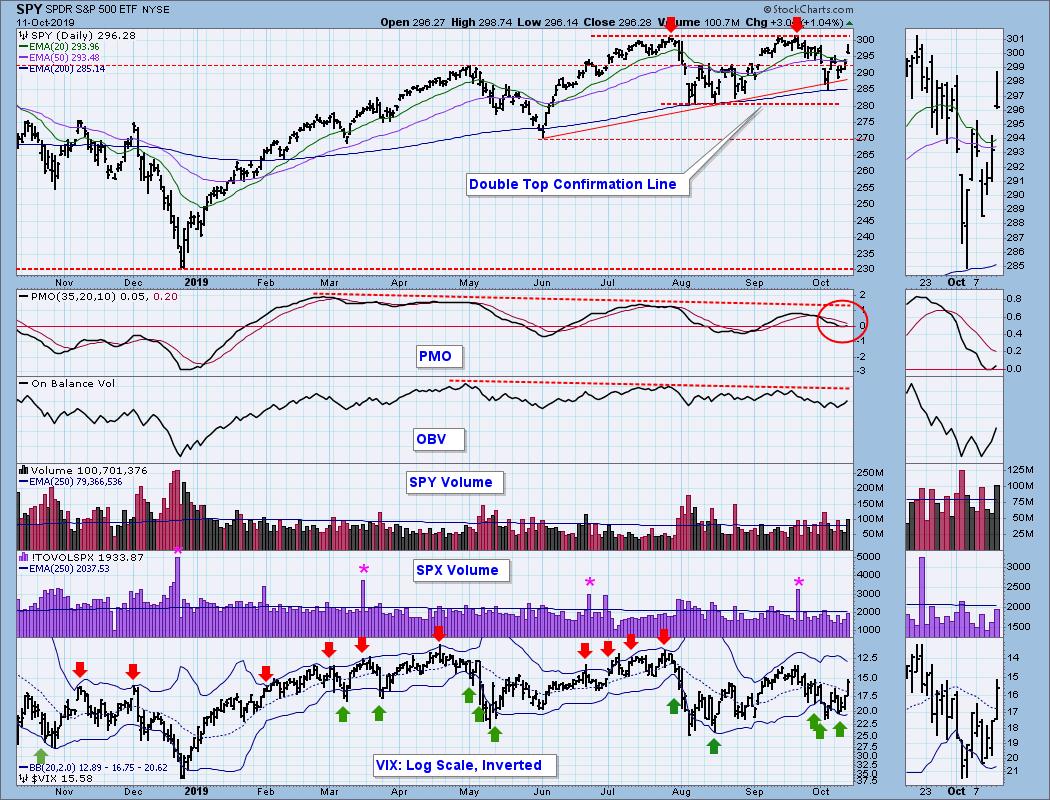
SPY Daily Chart: The market appears to be headed toward the top of a four-month range, at which it will challenge the old record highs. Once that happens, the double top structure will be irrelevant.
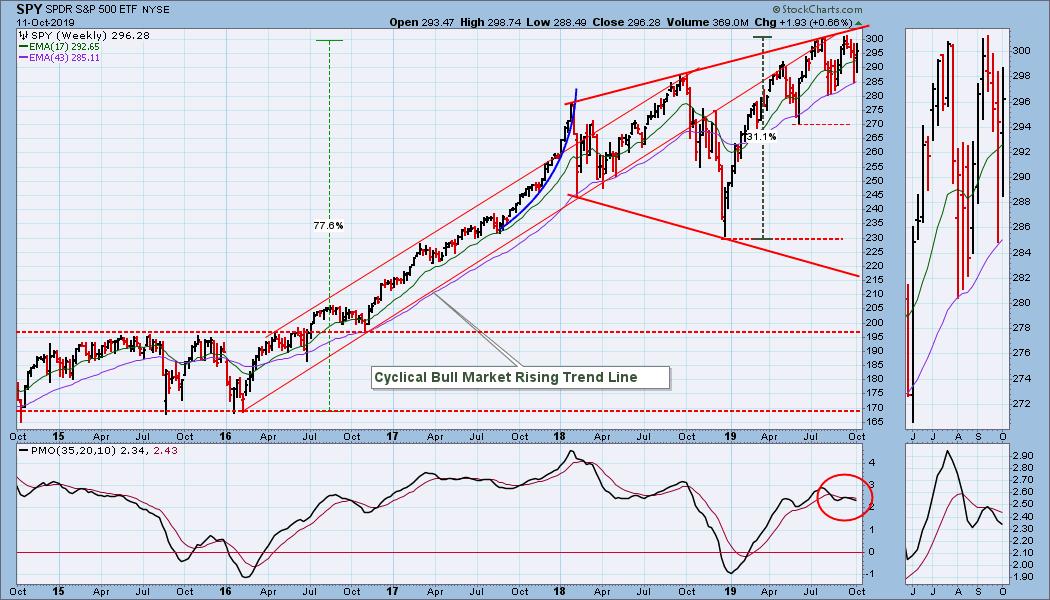
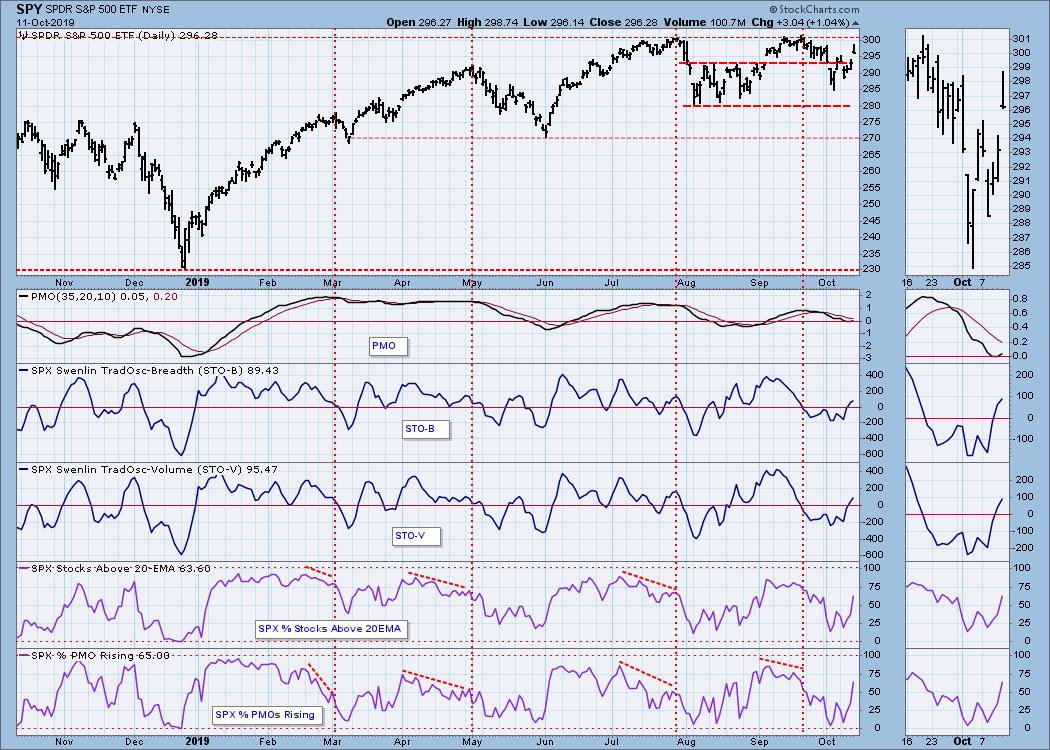
SPY Weekly Chart: For all the fireworks, the market closed up less than one percent for the week.
Climactic Market Indicators: Net breadth and net volume were upside climactic Friday, but the shooting star candlestick implies that it was an exhaustion climax.
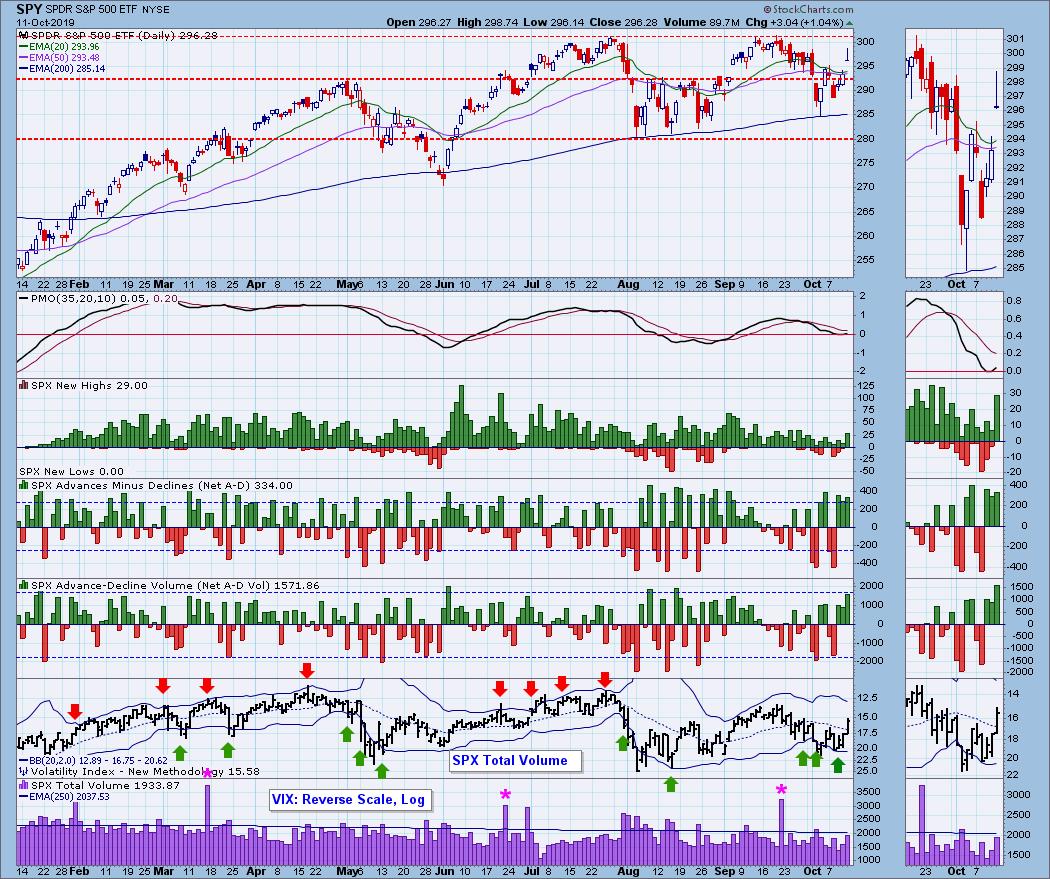
Short-Term Market Indicators: I have added two indicators for this time frame: Percentage of SPX Stocks Above Their 20EMA, and Percentage of SPX Stocks With Rising PMOs. They were added to help clarify short-term overbought and oversold conditions. Note how the STOs were slightly oversold earlier this month, whereas the new indicators were near the bottom of their range and clearly oversold.
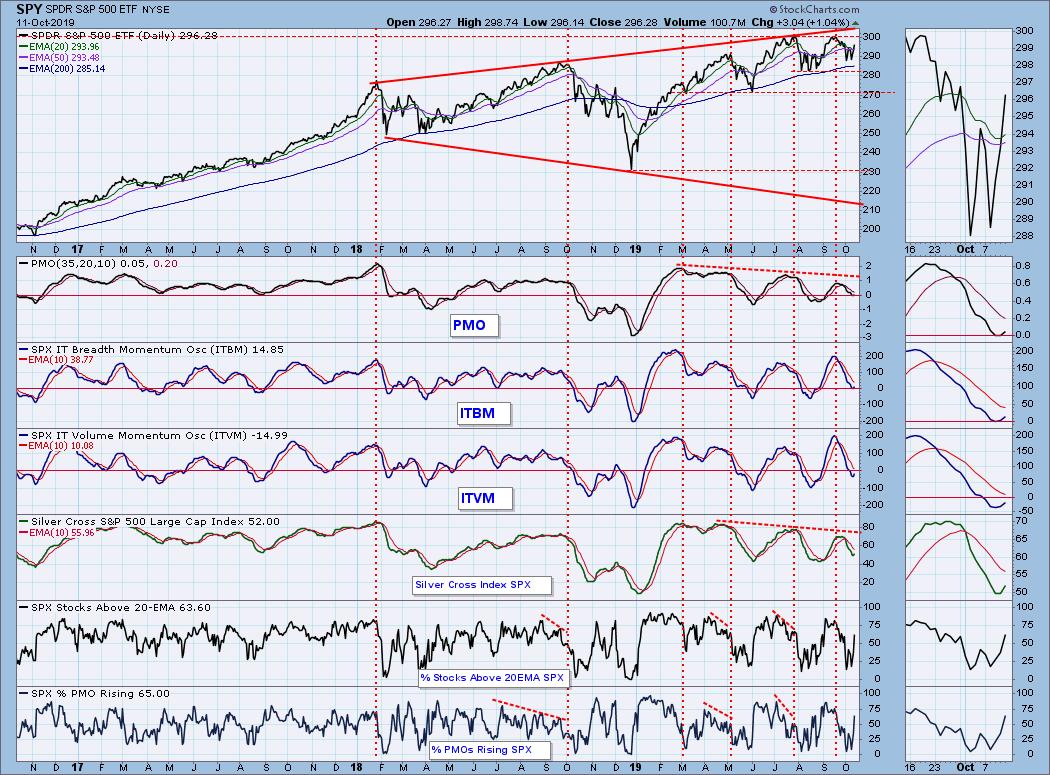
Intermediate-Term Market Indicators: The PMO, ITBM, ITVM, and Silver Cross Index have turned up from bull market oversold conditions, which is not very oversold at all, but we can see from the two previous lows that it can provide a decent base for a price advance.
CONCLUSION: We're supposed to be focused on technicals, but sometimes news rules the day. As details on the China trade talks are being revealed, they are sounding more positive, but it also sounds as if will take several weeks to finalize this phase of the deal, and a lot can go wrong during that time. I don't want to be stubbornly pessimistic, but I'm not going to be overly optimistic either. Back to the technicals, I can make a case for continued upside, but I don't like that shooting star* candlestick, or the light SPX Total Volume. Last week I was neutral about my expectations for this week, and that turned out to be not too far off the mark. I think I'll remain neutral in my expectations for next week.
Reminder: Next week is options expiration, so I expect low volatility toward the end of the week. That's not guaranteed, but that's usually how it turns out.
* Strictly speaking, Friday's candlestick on the SPY chart needs a little more body to be called a shooting star, but the one on the $SPX chart fills the bill perfectly.
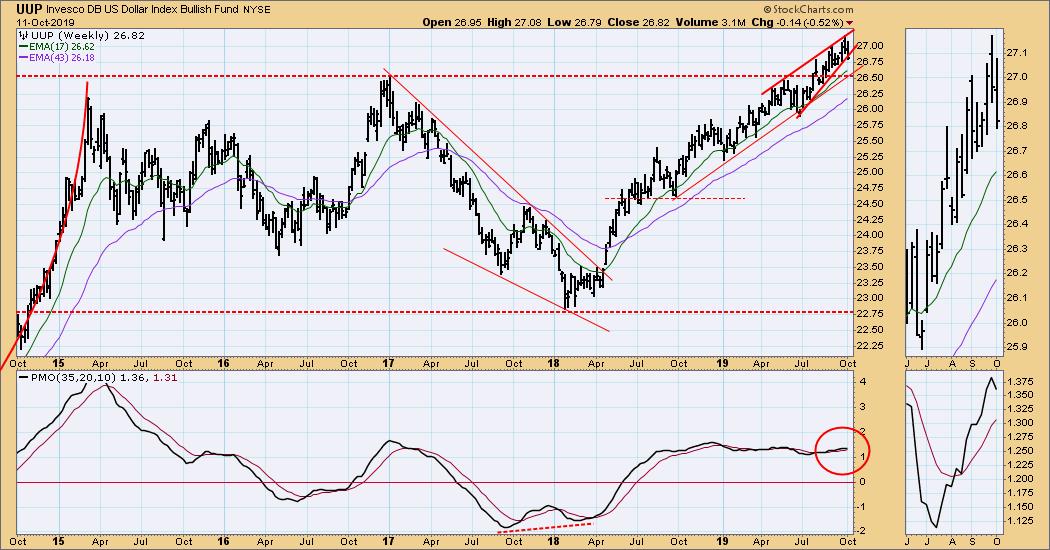
DOLLAR (UUP)
IT Trend Model: BUY as of 7/5/2019
LT Trend Model: BUY as of 5/25/2018
UUP Daily Chart: Price broke down through the bottom of a short-term rising wedge, as was the technical expectation.
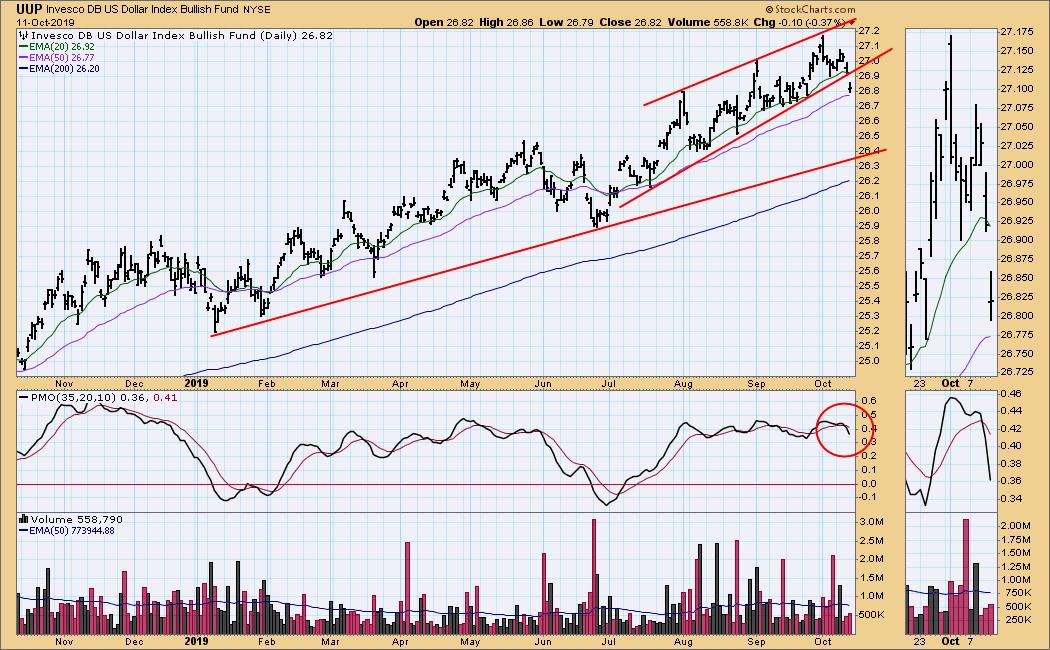
UUP Weekly Chart: The breakdown on the daily chart doesn't pose much of a problem in this time frame. After a modest correction, price will encounter long-term horizontal support and a rising trend line.
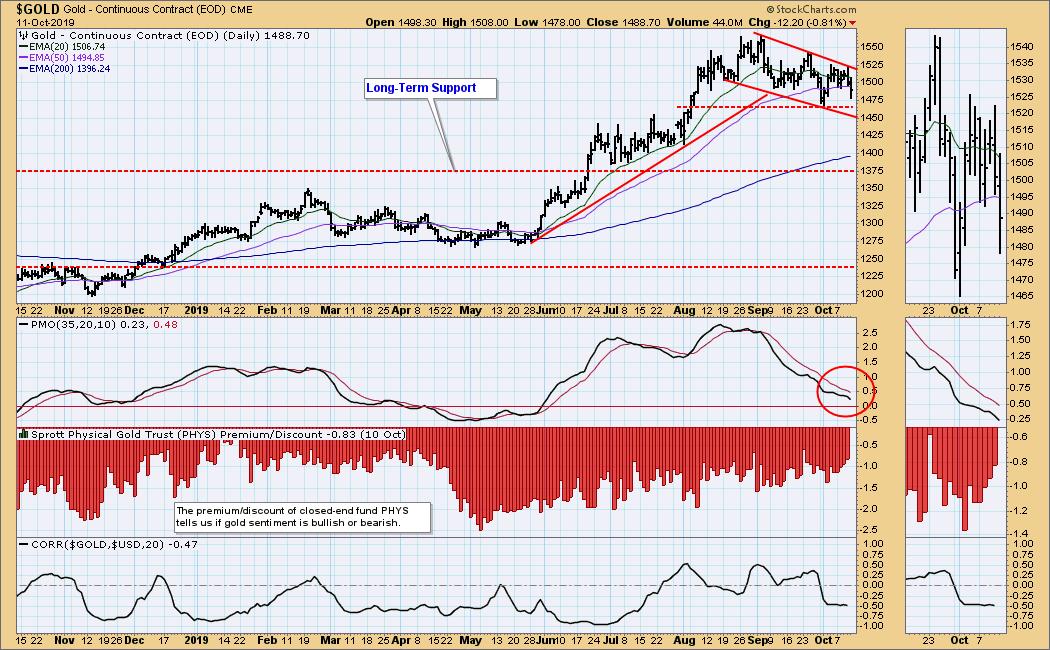
GOLD
IT Trend Model: BUY as of 6/3/2019
LT Trend Model: BUY as of 1/8/2019
GOLD Daily Chart: Gold is correcting in a declining trend channel, which could be viewed as a bullish flag formation. The big problem is that the commercials are heavily short gold. Surely, those guys aren't always right, but they usually do better than the rest of us, so I find it difficult to get too bullish with gold. Nevertheless, I'm liking how gold is behaving, and remind myself that short-covering could work in favor of gold bulls.
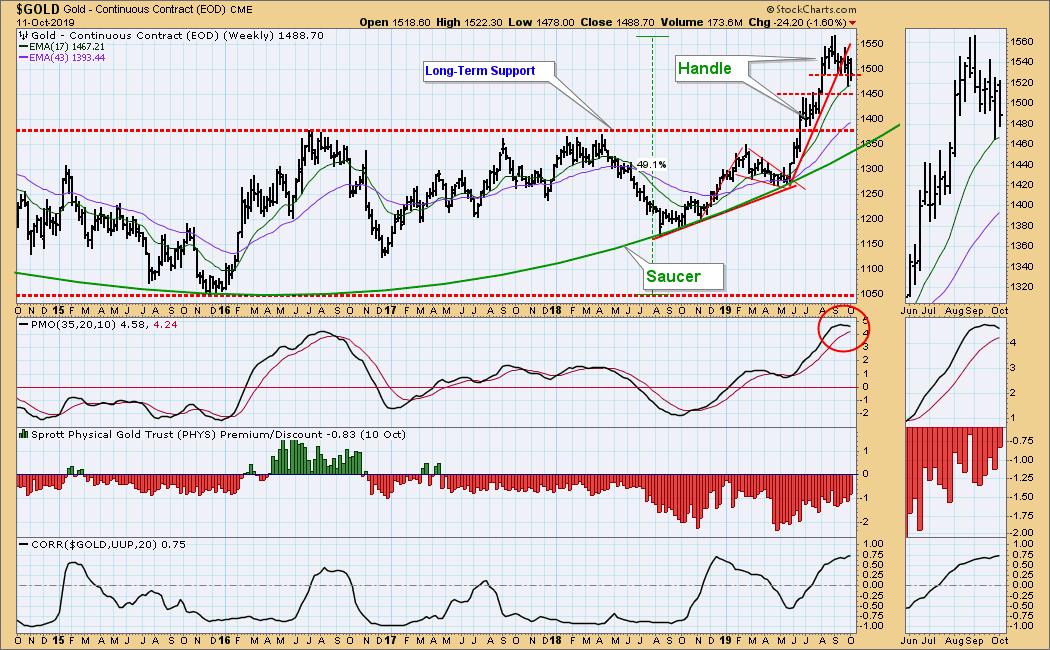
GOLD Weekly Chart: Gold is still well above the long-term support, and a bullish saucer with handle is partially visible. (The handle is simply a technical correction that follows the breakout.) The weekly PMO is overbought, implying that corrective action may take some time.
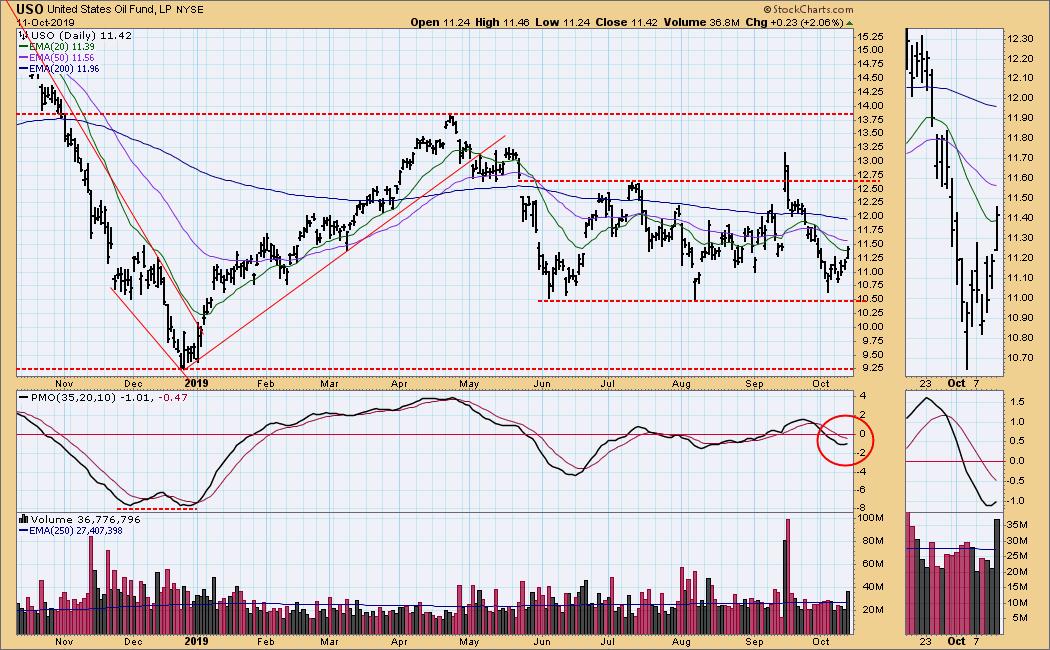
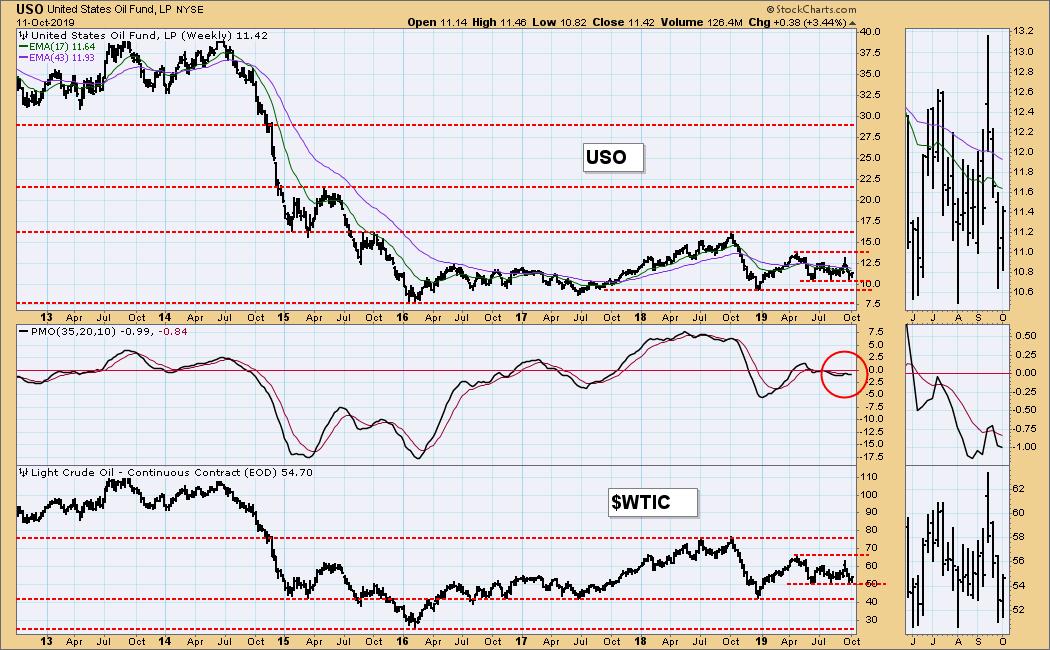
CRUDE OIL (USO)
IT Trend Model: SELL as of 10/2/2019
LT Trend Model: SELL as of 6/4/2019
USO Daily Chart: The fundamentals of crude oil are that there is plenty of it available. An attack on an Iranian tanker on Friday had little effect on price. It rallied, but it was already in a rising trend, having found support last week near the bottom of the four-month trading range.
USO Weekly Chart: In this time frame price for WTIC looks very stable within a range of about 50 to 66.
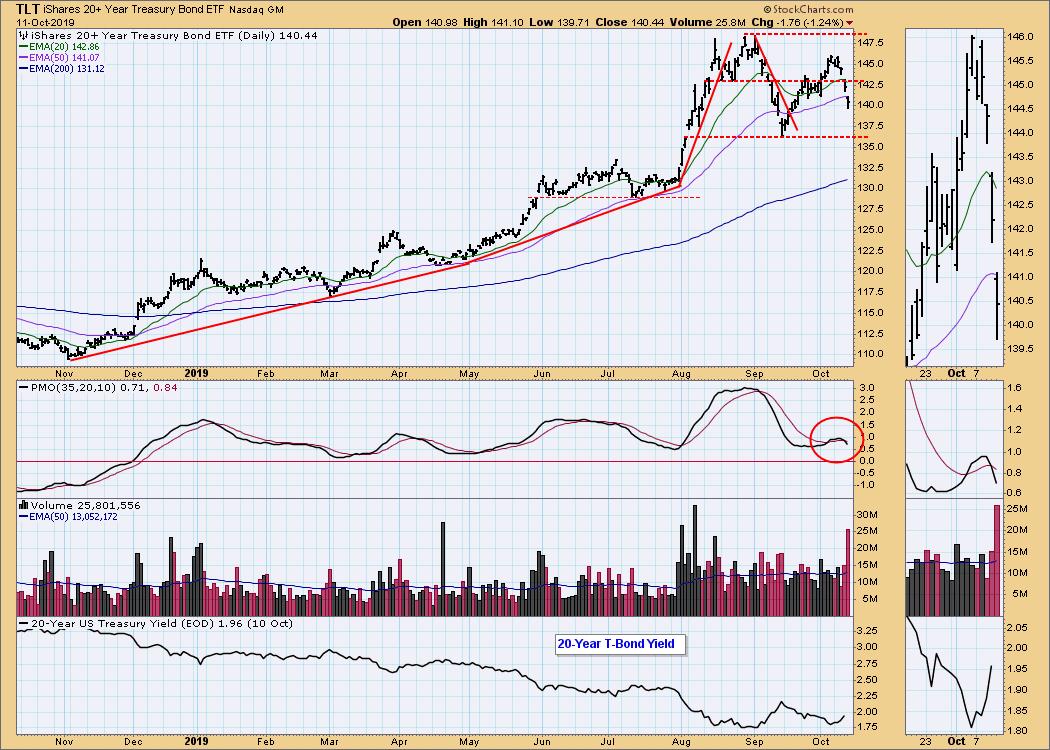
BONDS (TLT)
IT Trend Model: BUY as of 12/6/2018
LT Trend Model: BUY as of 1/2/2019
TLT Daily Chart: Bonds really unraveled this week, gapping down on Thursday and Friday. We saw somewhat similar action in early-September, so for now I'll look for support to enter the picture at about the same level as it did then.
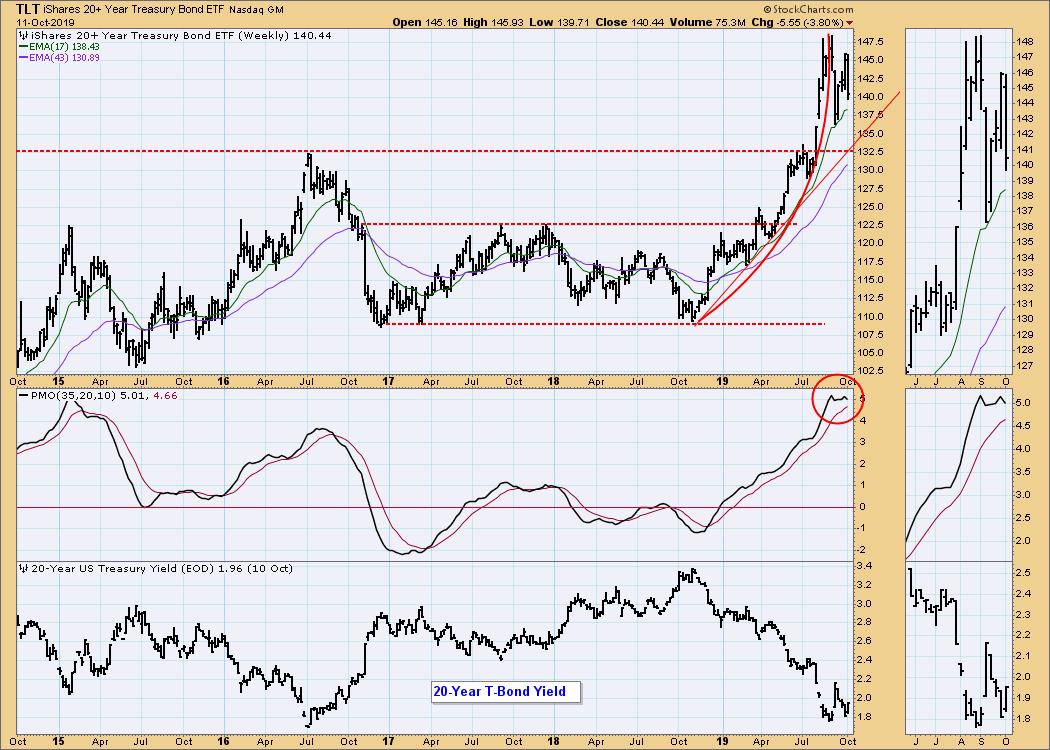
TLT Weekly Chart: This chart removes any mystery regarding the pullback. We can see the breakdown of a parabolic advance, a bounce, and now a continuation of the decline. The weekly PMO is very overbought, but there is good support at 132.50.
**Don't miss any of the DecisionPoint commentaries! Go to the "Notify Me" box toward the end of this blog page to be notified as soon as they are published.**
Technical Analysis is a windsock, not a crystal ball.
Happy Charting! - Carl
NOTE: The signal status reported herein is based upon mechanical trading model signals, specifically, the DecisionPoint Trend Model. They define the implied bias of the price index based upon moving average relationships, but they do not necessarily call for a specific action. They are information flags that should prompt chart review. Further, they do not call for continuous buying or selling during the life of the signal. For example, a BUY signal will probably (but not necessarily) return the best results if action is taken soon after the signal is generated. Additional opportunities for buying may be found as price zigzags higher, but the trader must look for optimum entry points. Conversely, exit points to preserve gains (or minimize losses) may be evident before the model mechanically closes the signal.
Helpful DecisionPoint Links:
DecisionPoint Shared ChartList and DecisionPoint Chart Gallery
Price Momentum Oscillator (PMO)
Swenlin Trading Oscillators (STO-B and STO-V)