
Today is "Reader Request Thursday"! My readers provided me with well over 30 symbols to review to see if I agree with them that they are diamonds in the rough. It was an interesting group of choices. Some of my readers picked stocks in areas of the market they are watching closely. One of the picks I actually own, so I had to review that one. We are in a favorable seasonality period, with the "Santa Claus" rally lined up for Christmas Eve through the new year. Although, in case you forgot (unlikely), the market crashed further on Christmas Eve last year. Seasonality is helpful, but knowing current market trends and vulnerability is important - last Christmas Eve proved it. I won't be writing in the DecisionPoint Blog next week to take time off for Christmas, but I will be back on 12/30/2019. Carl will be writing the Weekly Wrap on 12/20 and 12/27/2019.
Don't forget, on Thursdays I look at reader-requested symbols, so shoot me an email at erinh@stockcharts.com. I read every email I receive and try to answer them all! Your insight helps me to tailor my commentary to what my readers and viewers want to hear about.
Welcome to DecisionPoint Daily Diamonds, wherein I highlight five "diamonds in the rough." These are selected from the results of my DecisionPoint scans, which search for stocks that could benefit from the trend and condition of the market. Remember, these are not recommendations to buy or sell, but are the most interesting of the stocks that surfaced in my scans. My objective is to save you the work of the initial, tedious culling process, but you need to apply your own analysis to see if these stocks pique your interest as well. There are no guaranteed winners here!
Current Market Outlook:
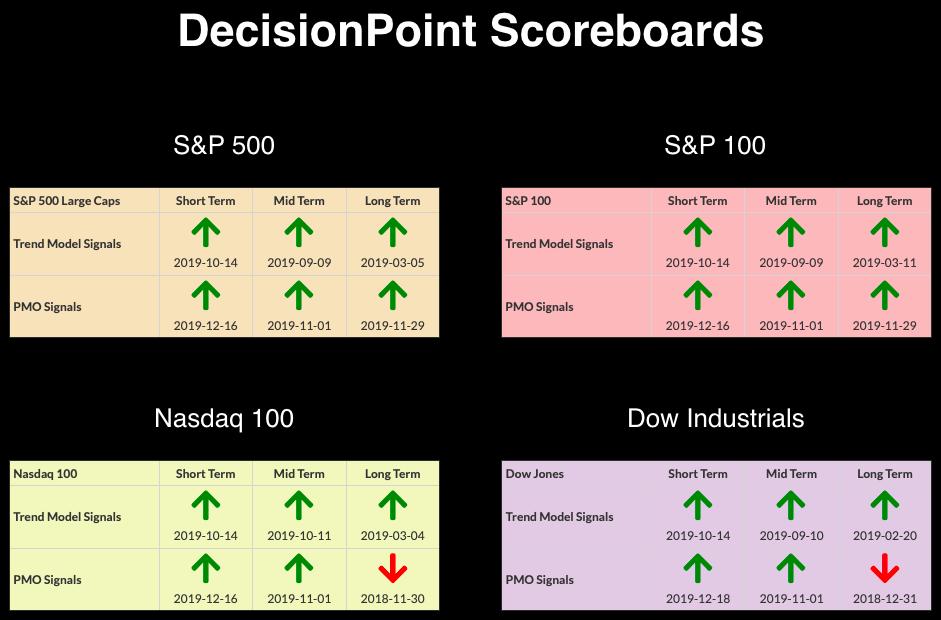
Market Trend: Currently, we have Trend Model BUY signals in all three timeframes on the DP Scoreboard Indexes.
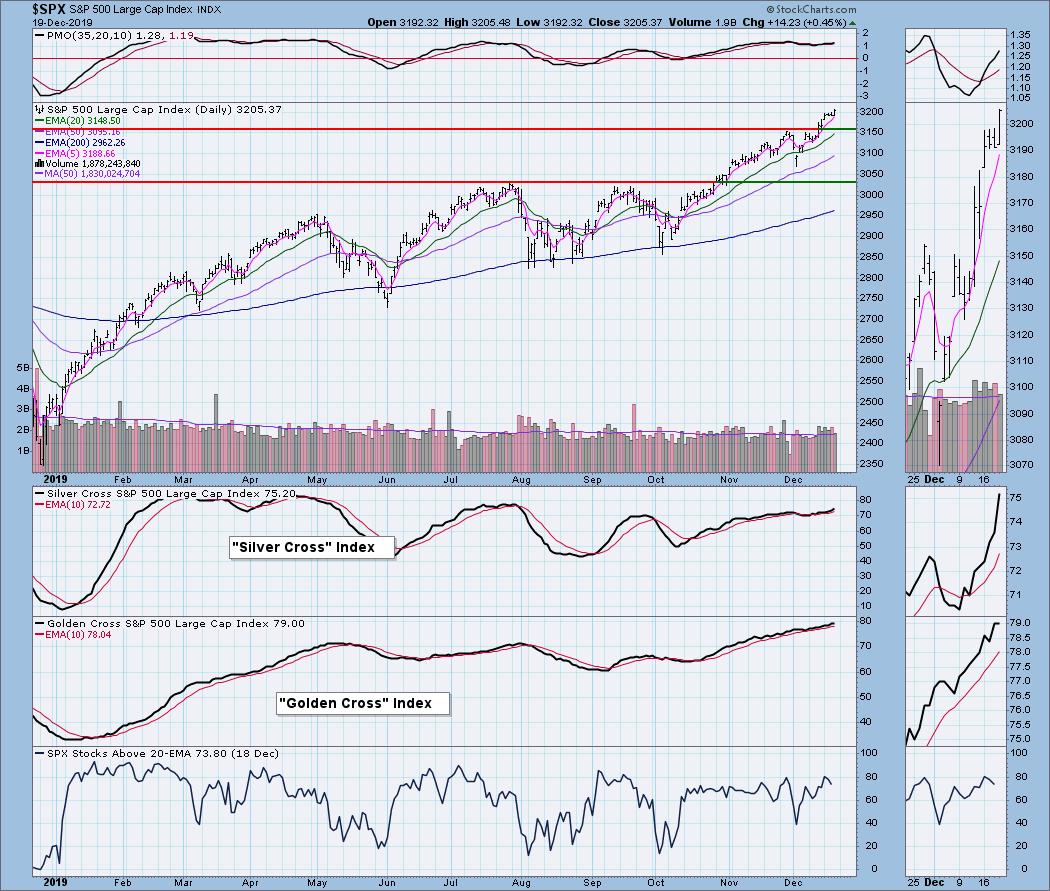
Market Condition: The market is rallying higher. While it can be considered overbought, we must remember that, in a bull market, overbought conditions can persist.
Market Environment: It is important to consider the odds for success. The Silver Cross Index measures the percentage of stocks on IT Trend Model BUY signals (20-EMA > 50-EMA), while the Golden Cross Index measures the percentage of stocks on LT Trend Model BUY signals (50-EMA > 200-EMA). Here are the current percentages on the Silver and Golden Cross Indexes:
Diamond Index:
- Diamond Scan Results: 12
- Diamond Dog Scan Results: 2
- Diamond Bull/Bear Ratio: 6.00
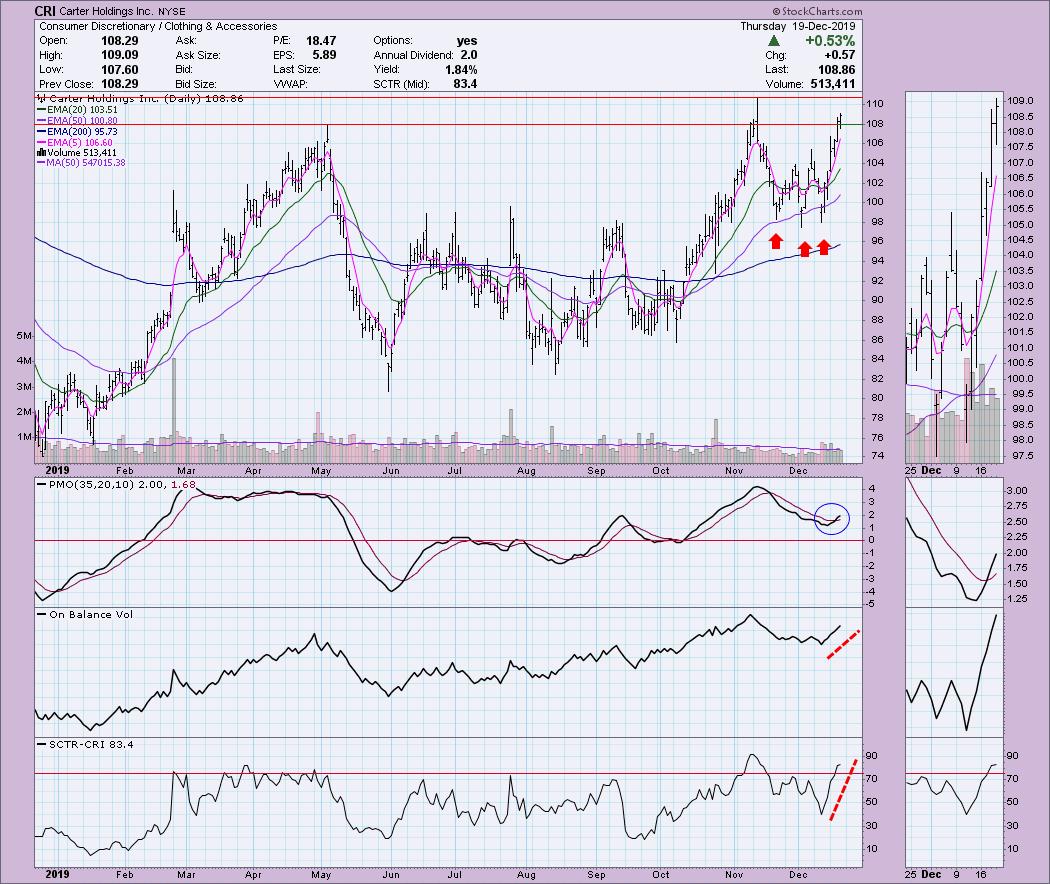
Carter Holdings Inc (CRI) - Earnings: 2/24 - 2/28/2020
CRI broke out above the May top; it is now headed toward overhead resistance at the intraday high from mid-November. We did see the highest closing price for the year. The PMO just triggered a BUY signal and both the OBV and SCTR are trending higher. As far as a price pattern, I am looking at a triple bottom that came off the decline in November. I would look for price to break out above $110.
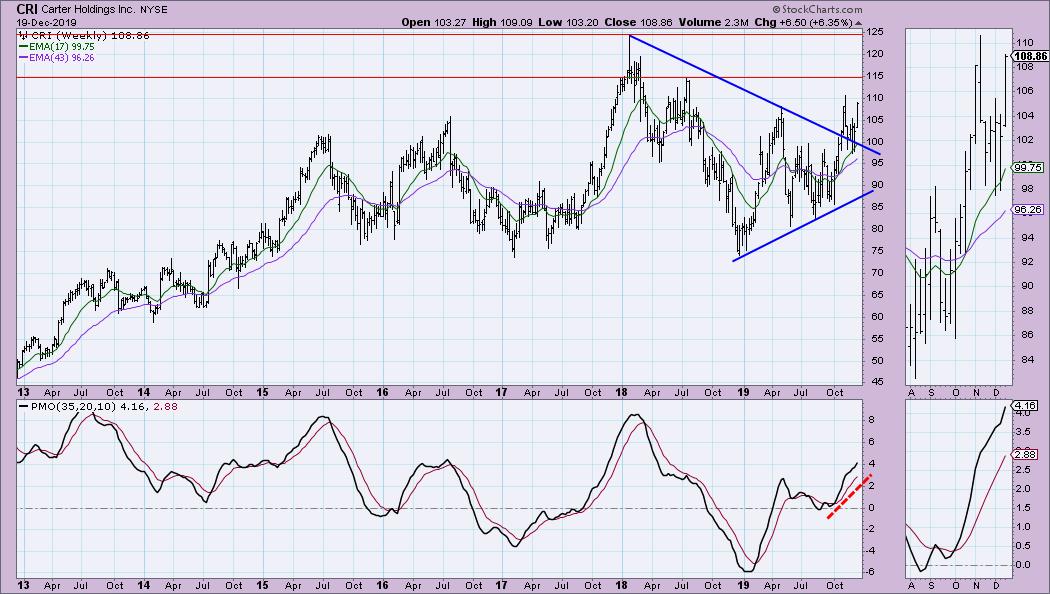
Looking at the weekly chart, I see the execution of a symmetrical triangle. I think you could even make a case for a complex double-bottom. Both patterns suggest higher prices. I note that strong resistance at $115 is actually higher than on the daily chart of $110. The PMO is accelerating higher and is not overbought.
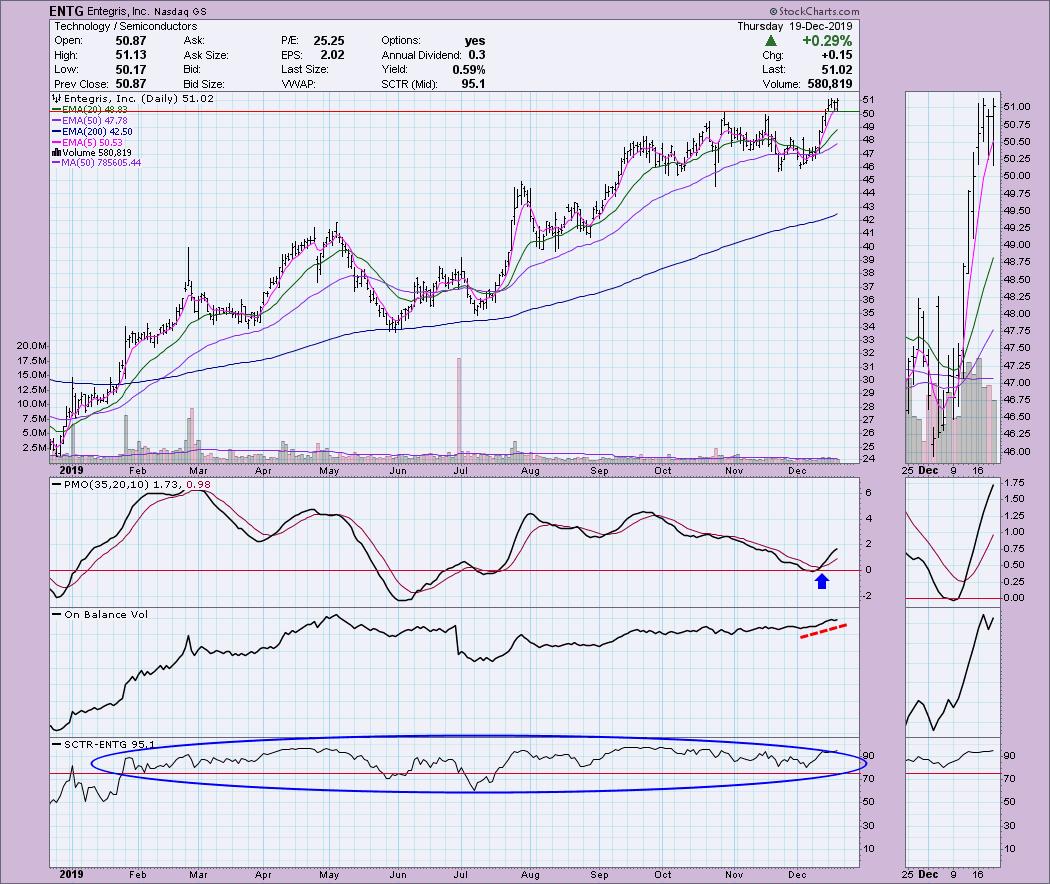
Entegris Inc (ENTG) - Earnings: 2/3 - 2/7/2020
Last week, ENTG began a nice rally. This week, it is consolidating the move. I like that this consolidation zone has settled above support at the Oct/Nov highs. The OBV broke higher than previous highs on last week's breakout. The SCTR shows us that it has been one of the strong performers among mid-cap stocks.
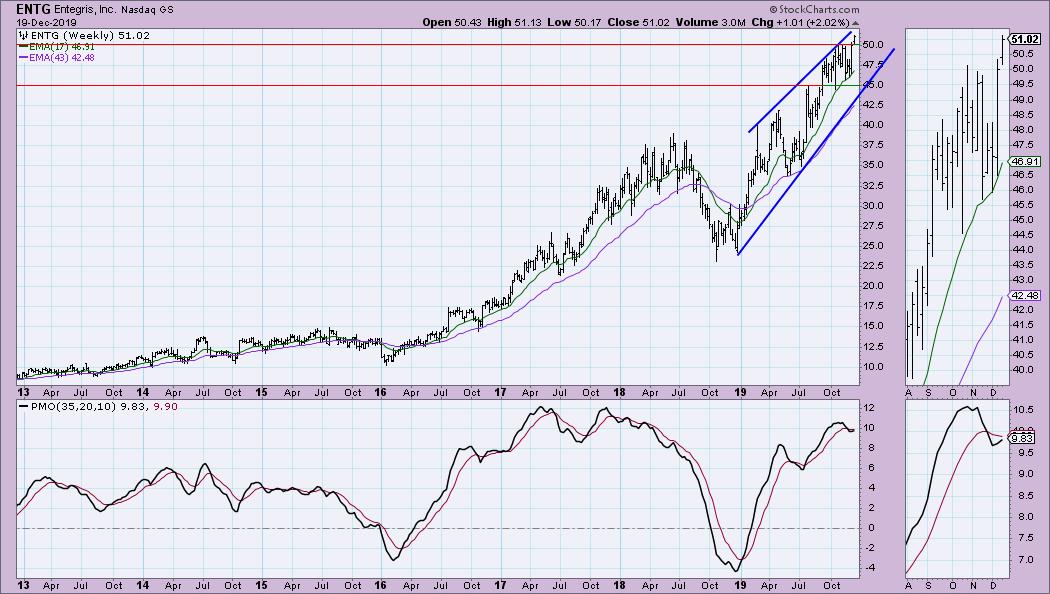
The weekly chart isn't as bullish. While the PMO has ticked up, a steep rising wedge has formed; that pattern suggests a breakdown ahead, not a long-term continuation of the rally. This is not to say that it will stop climbing, only that you should keep an eye on the weekly as well as the daily chart.
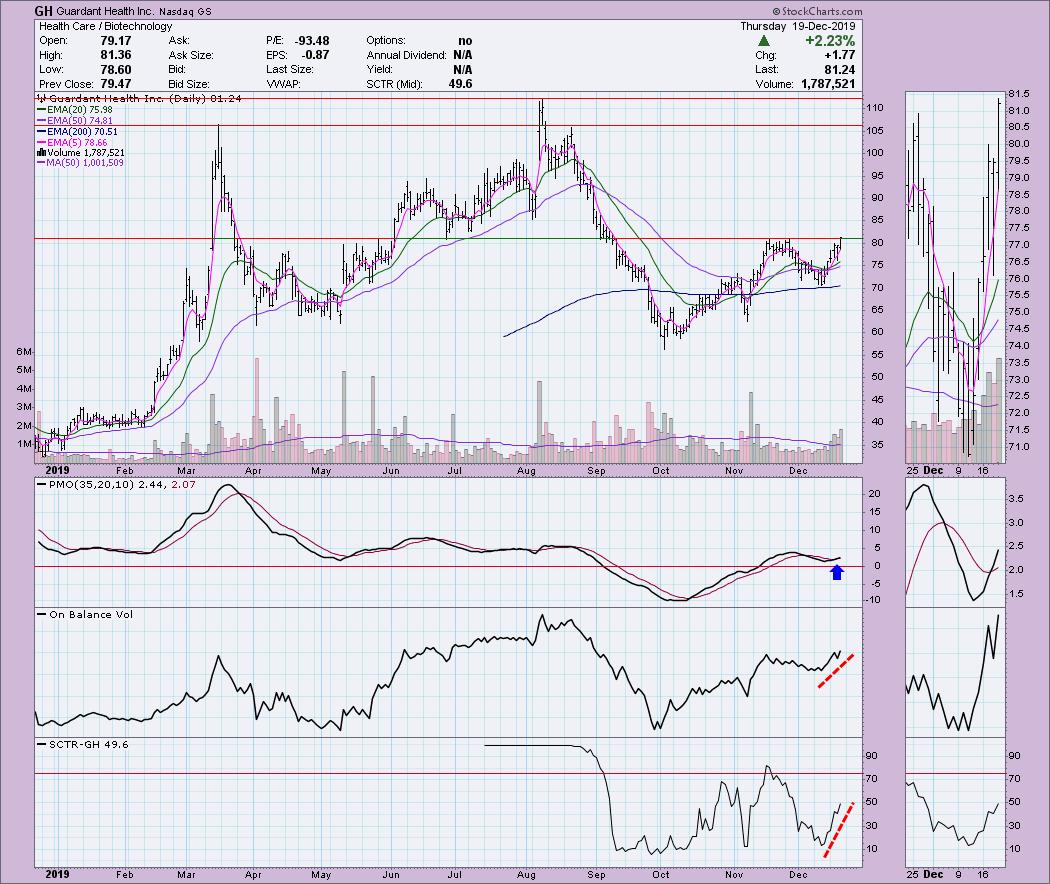
Guardant Health Inc. (GH) - Earnings: 11/7/2019
Price closed at its highest point since November, which gives us a tiny breakout above November highs. The PMO has generated a BUY signal and the OBV is confirming the current rally. The SCTR is bounding higher. If the breakout sticks, I don't see serious overhead resistance until price reaches above $105.
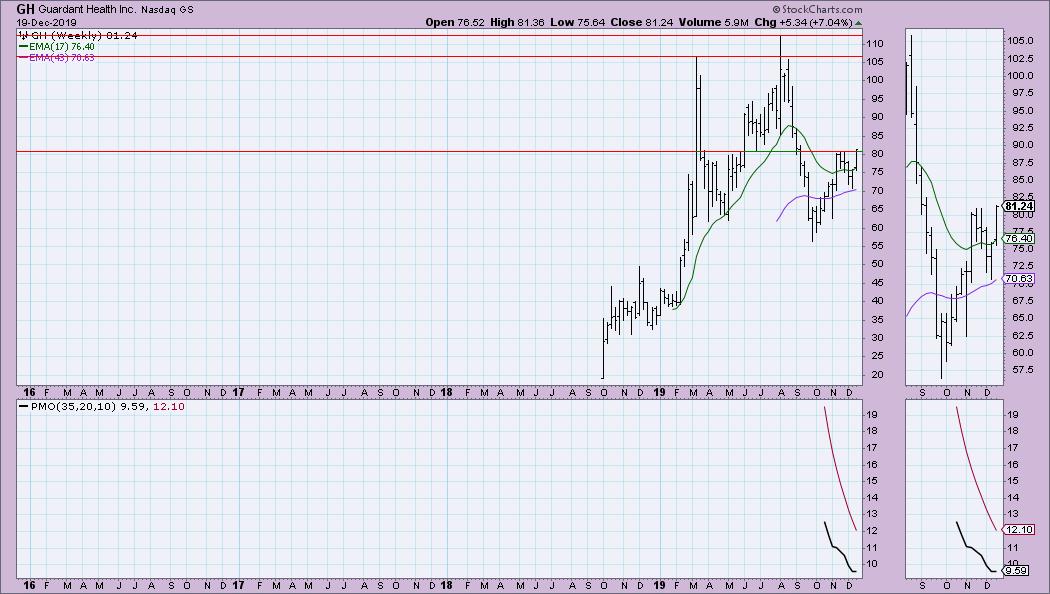
There isn't much data to look at on the weekly chart, but it does illustrate the strength of overhead resistance at $105.
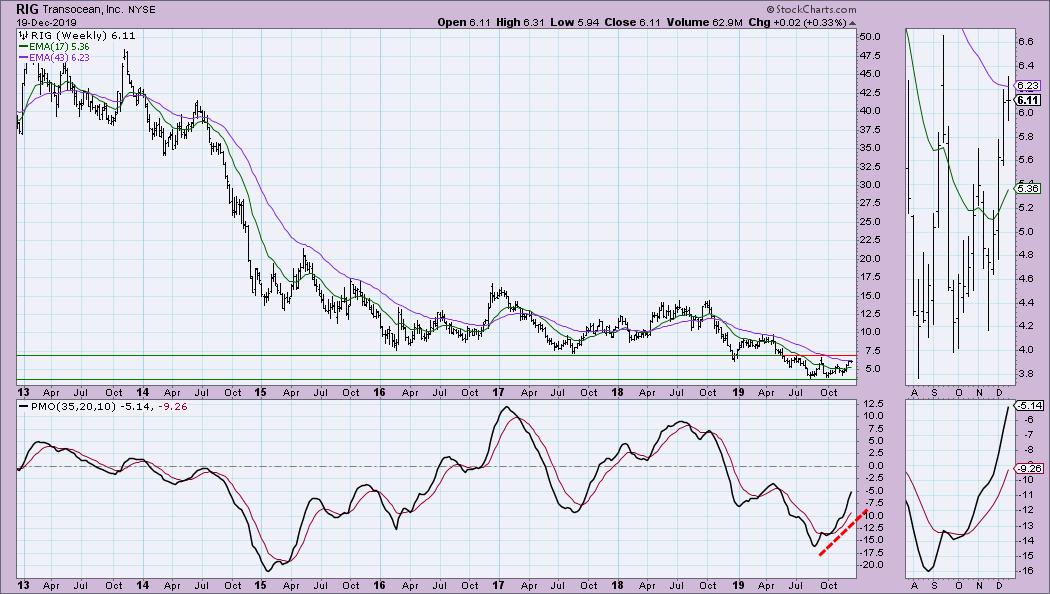
Transocean Inc (RIG) - Earnings: 2/17 - 2/21/2020
I've traded RIG before, where I enjoyed a nice rally before it broke down in April. Right now, there are bullish possibilities. There is a not-so-textbook triple-bottom pattern. Typically, the top that was in November would come closer to even with the September top. The PMO appears overbought, but we can see the bottom of the range has been around -10, so the upper range could be around +10. The OBV is confirming the rally and the SCTR shows us that RIG is a rising star among mid-caps.
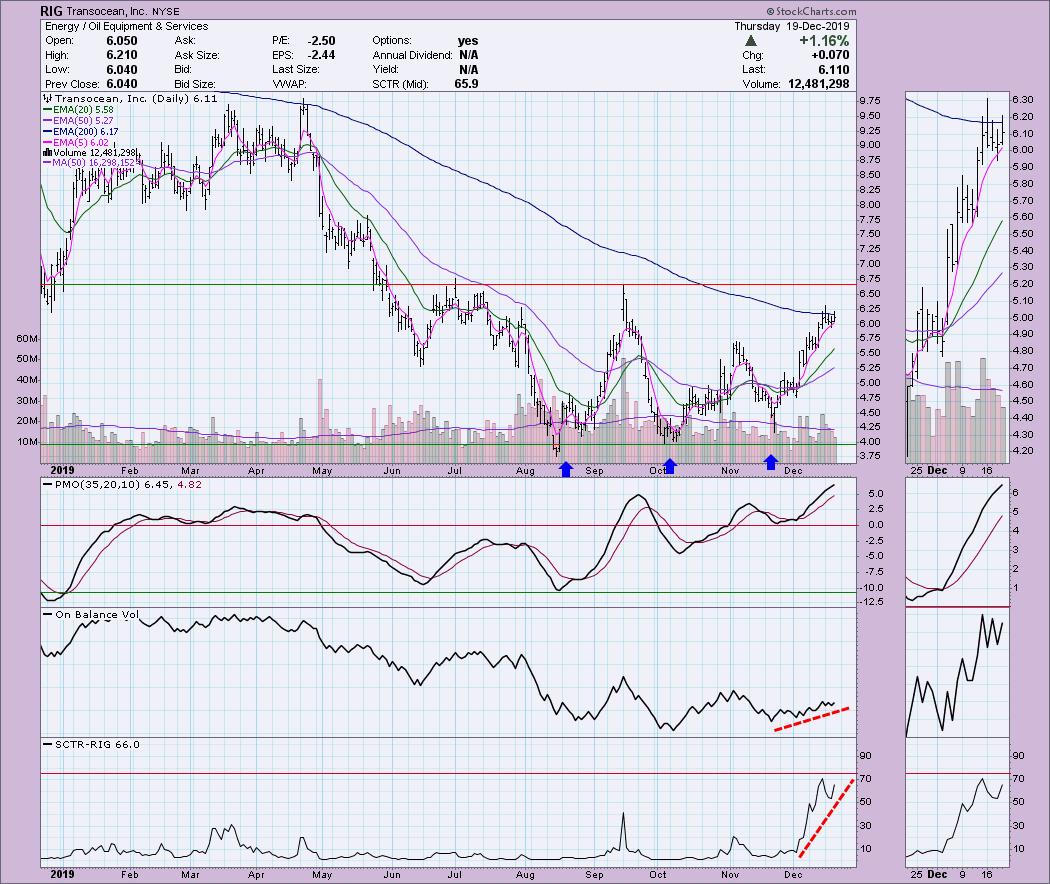
Overhead resistance at $7.50 is a possible stopping point on this rally. If price manages to break out there, new overhead resistance wouldn't arrive until $15.
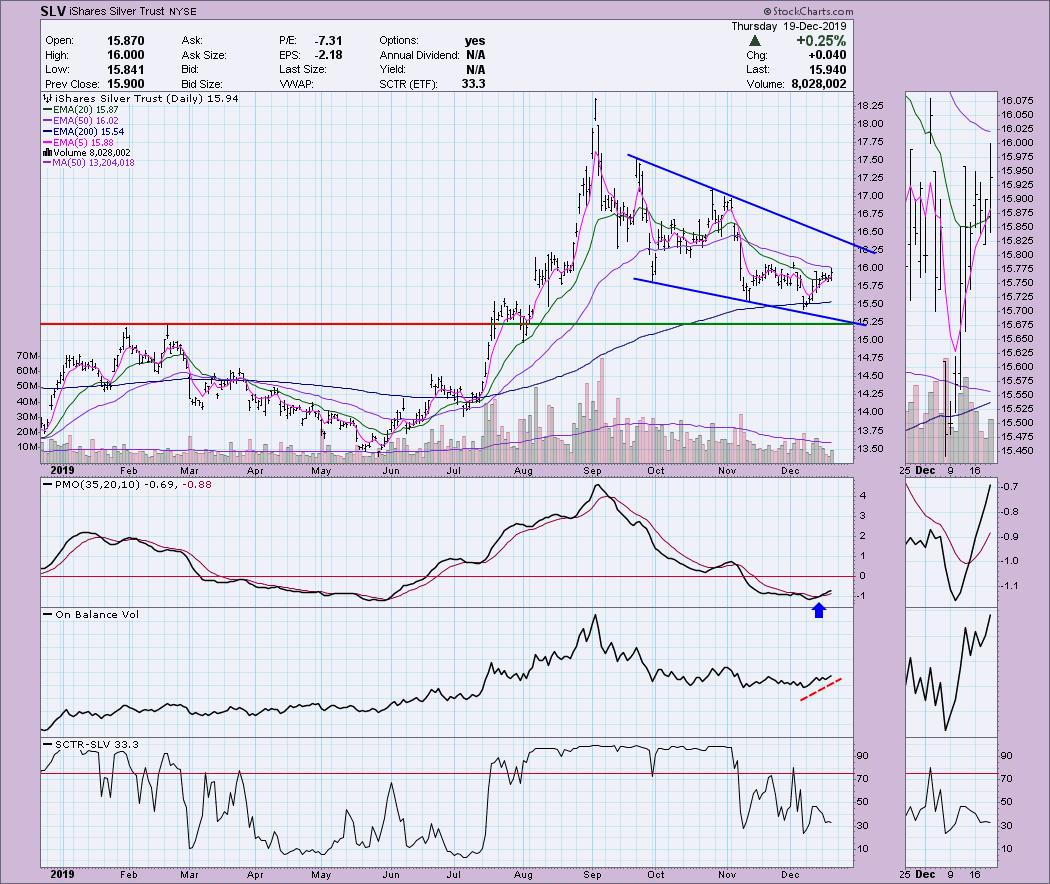
iShares Silver Trust (SLV) - Earnings: N/A
Full disclosure, I do own this ETF. I generally hold both Gold and Silver ETFs for asset allocation reasons. The set up right now looks pretty good on the daily chart. We have a bullish falling wedge and a new PMO BUY signal. The OBV is confirming the rally. I'm not thrilled with the SCTR configuration, but I'll forgive it. Short-term overhead resistance would be around $16.10. After that, I'd watch the declining tops trend line for an execution of the wedge pattern.
I'm not a fan of the weekly chart given the negative configuration of the PMO; however, price is at a make-or-break area. If price can continue to hold above the 43-week EMA and the 1st quarter 2019 high, I would look for price to rise and the PMO to swing.
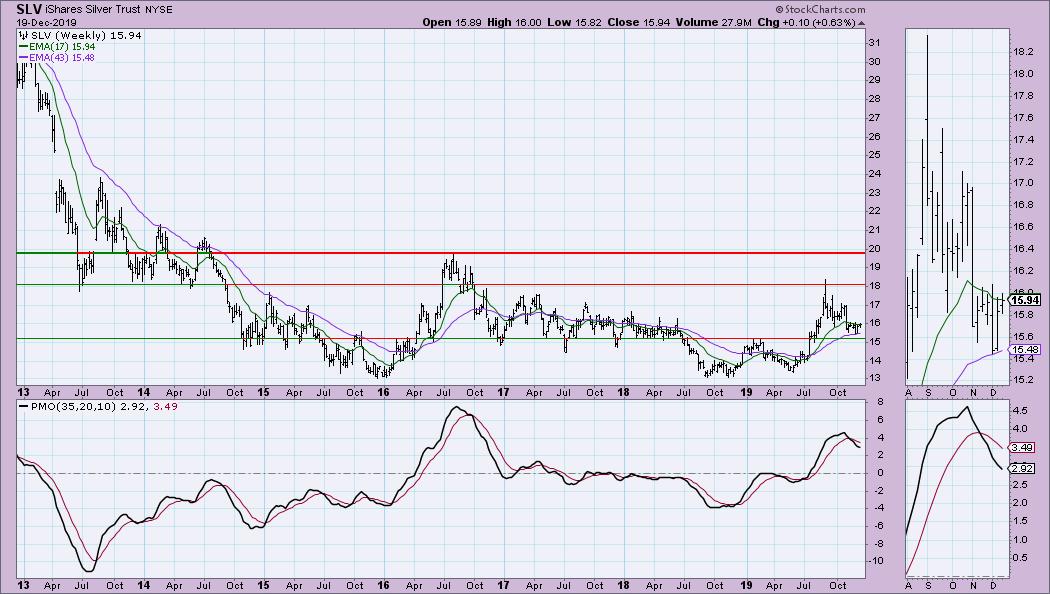
Full Disclosure: I own SLV. I added a few positions today so I am about 65% cash.
Market Vision 2020 - Sign Up for Details
I am so excited to participate in "Market Vision 2020", an online financial conference on Saturday, January 4, 2020 to kick off the new year. Make sure you're subscribed to the Market Vision 2020 newsletter in order to receive the latest updates on the event (and save a lot of money if you decide to attend!). *Click Here* to subscribe to the free newsletter. There will be lots of giveaways and free educational events for everyone who follows along – don't be left out!

Erin Swenlin will be presenting at the The MoneyShow Las Vegas on May 11-13, 2020! You'll have an opportunity to meet Erin and discuss the latest DecisionPoint news and Diamond Scans. The conference is free to attend or view online!
Watch the latest episode of DecisionPoint with Carl & Erin Swenlin LIVE on Mondays 5:00p EST or on the StockCharts TV YouTube channel here!
Technical Analysis is a windsock, not a crystal ball.
Happy Charting!
- Erin
erinh@stockcharts.com
NOTE: The stocks reported herein are from mechanical trading model scans that are based upon moving average relationships, momentum and volume. DecisionPoint analysis is then applied to get five selections from the scans. The selections given should prompt readers to do a chart review using their own analysis process. This letter is not a call for a specific action to buy, sell or short any of the stocks provided. There are NO sure things or guaranteed returns on the daily selection of "diamonds in the rough."
Helpful DecisionPoint Links:
DecisionPoint Shared ChartList and DecisionPoint Chart Gallery
Price Momentum Oscillator (PMO)
Swenlin Trading Oscillators (STO-B and STO-V)
**Don't miss DecisionPoint Commentary! Add your email below to be notified of new updates"**