An indicator that has become a favorite of mine is the Percentage of Stocks Above the 20EMA, because it is very straight forward and easily understood. Then a stock's price is above its 20EMA, it is a sign of strength, and, conversely, it is a sign of weakness when price is below its 20EMA. My technique is to draw vertical lines through prominent price peaks, and then observe the indicator behavior as it approaches the vertical lines. Below are some examples of how, when the indicator diverges negatively from a rising price, it is a caution sign that a price top may be at hand.
Obviously, in real time we have to keep moving the vertical line to the right, and we won't know when an important price top has been made until some time after the event, but we can watch the indicator divergences as they develop, and anticipate possible price reversals.
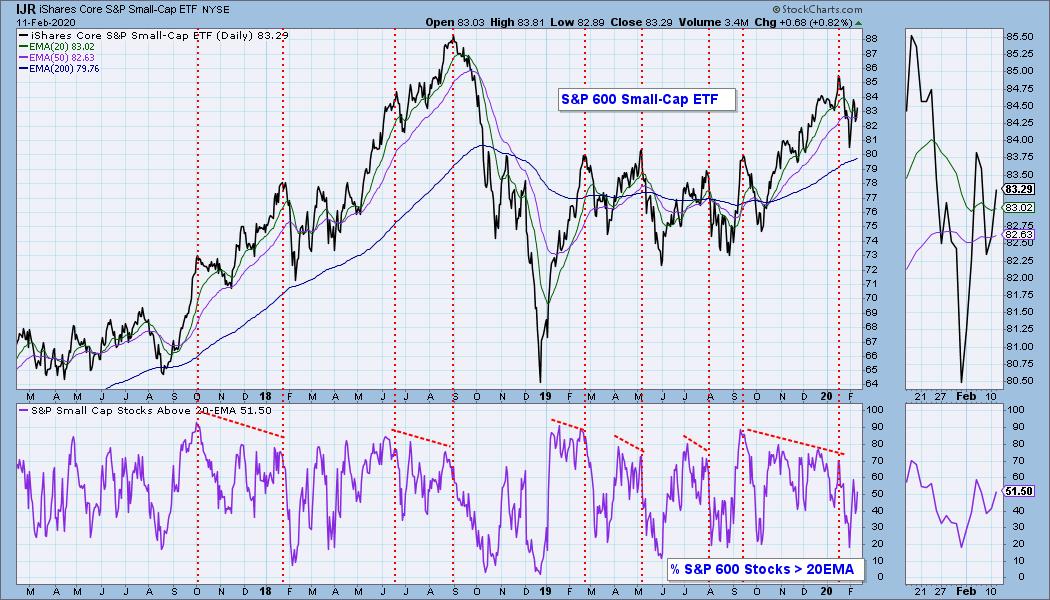
This chart is for the S&P 600 Small-Cap Index. Note that only 51.5% of its component stocks are above their 20EMA. This thin participation does not nstill a lot of confidence in the small-cap market.

As investors we want to accomplish two basic things: (1) Determine the trend and condition of the market, and (2) select stocks that will ride that tide. The DecisionPoint Alert helps with the first step, and DecisionPoint Diamonds helps with the second. Go to DecisionPoint.com and SUBSCRIBE TODAY! (Charter Subscriber Discounts Available!)
StockCharts.com also has the indicator for the major U.S. market indexes as well as for the eleven S&P 500 sectors. I think it is a great indicator, and the only problem I have is trying to come up with a short name for it.
Happy Charting! - Carl
Technical Analysis is a windsock, not a crystal ball.
Helpful DecisionPoint Links:
DecisionPoint Alert Chart List
DecisionPoint Golden Cross/Silver Cross Index Chart List
DecisionPoint Sector Chart List
Price Momentum Oscillator (PMO)
Swenlin Trading Oscillators (STO-B and STO-V)