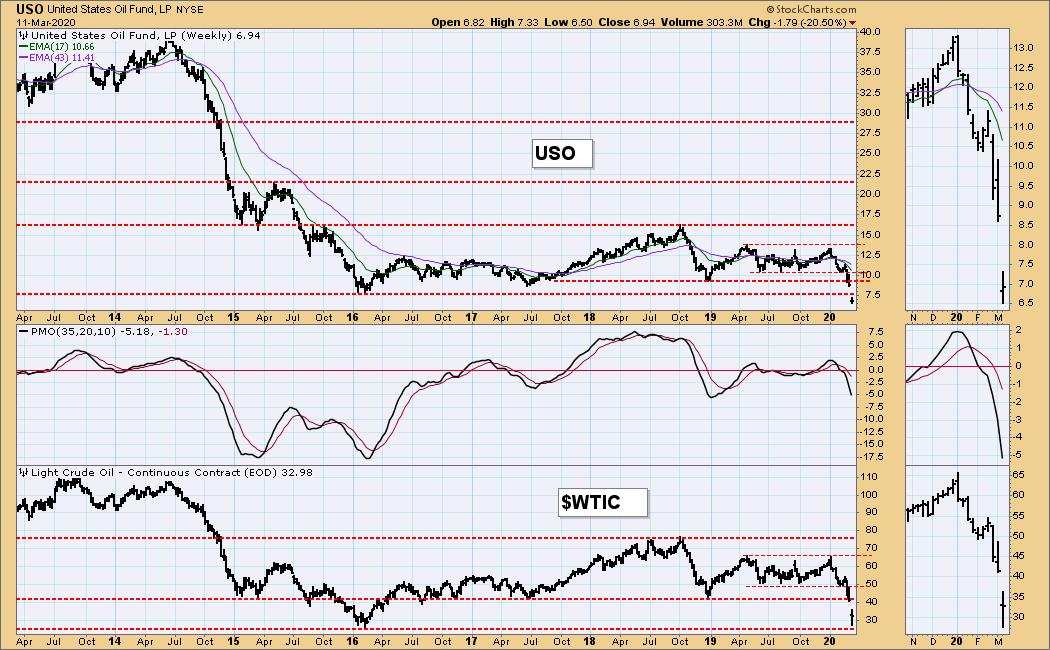
We track crude oil using the ETF USO because it makes oil accessible for trading without having to get involved in future contracts; however, you will notice that USO has a slight downward bias when compared to $WTIC, the continuous contract dataset for tracking the futures price. The reason for USO's downward bias is that it incorporates the slippage encountered with rolling futures contracts. Nevertheless, the ubiquitous benchmark for oil is the price per barrel, so I also track $WTIC, which also is the best reference for long-term support and resistance.
With the recent crash in oil prices, USO broke down through the support line drawn across the 2016 low. While $WTIC has remained above that line, I'm now wondering what the next support level might be.

As investors we want to accomplish two basic things: (1) Determine the trend and condition of the market, and (2) select stocks that will ride that tide. The DecisionPoint Alert helps with the first step, and DecisionPoint Diamonds helps with the second. Go to DecisionPoint.com and SUBSCRIBE TODAY! (Charter Subscriber Discounts Available!)
USO doesn't have a very deep price history, so we'll have to use $WTIC to find the psychological support levels with historical significance. It appears that there is fairly well-defined support at 25.40 and 17.00, but the most obvious support level is at a line drawn across the 1986 and 1998 lows -- 10.00. That is not my price target, but it is not out of the question that it may be challenged.
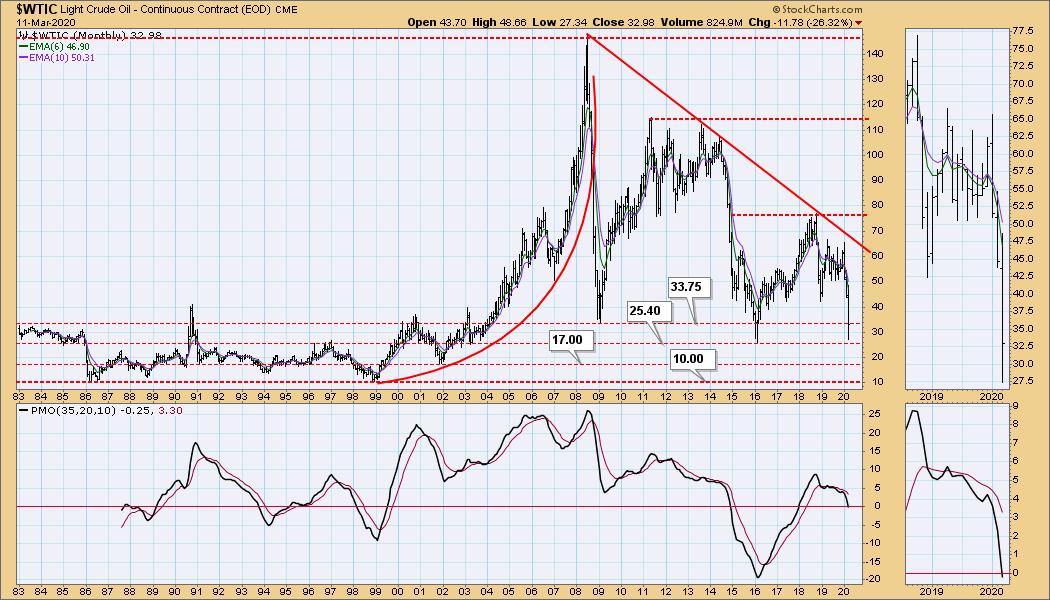
Because of the coronavirus slow down, crude oil prices were doing poorly before the price war between Saudi Arabia and Russia was thrust upon us. An improvement in that situation could relieve some of the selling, but the global slowdown is still the primary issue here, so I think lower support levels will be challenged.
This will be an ongoing crisis, and I will be adding this chart to our subscriber chart list.
Technical Analysis is a windsock, not a crystal ball.
Helpful DecisionPoint Links:
DecisionPoint Alert Chart List
DecisionPoint Golden Cross/Silver Cross Index Chart List
DecisionPoint Sector Chart List
Price Momentum Oscillator (PMO)
Swenlin Trading Oscillators (STO-B and STO-V)