Murphy's Law says that if something can go wrong, it will. Bear Market Rules say that even bullish chart formations are more likely to resolve bearishly, and while reviewing the sector charts this morning, I saw many examples of this. In particular, I saw a lot of broken flag (and pennant) formations. Flag formations are usually bullish. They begin to form after a sharp advance (the flag pole), and their purpose is to consolidate the rally in preparation for the next leg up. When they do the opposite, it reflects negatively on the sector. When we see more than one sector, it reflects negatively on the market.
Ten of the eleven S&P 500 sectors had price reversals today, four of which came out of flag formations. Wait for the end to see the lone holdout. (*These are all intraday snapshots and do not reflect today's close.)
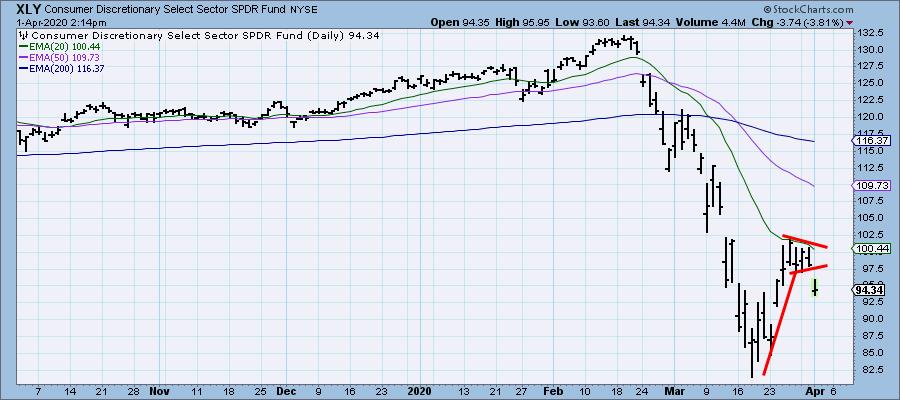
Consumer Discretionary
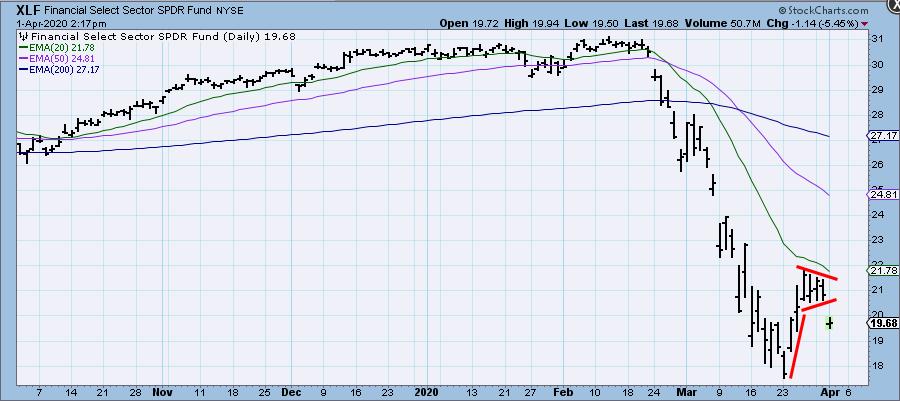
Financial
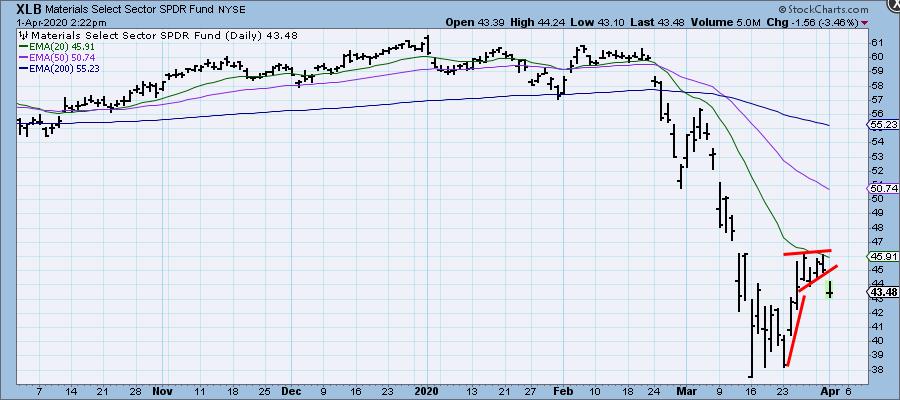
Materials
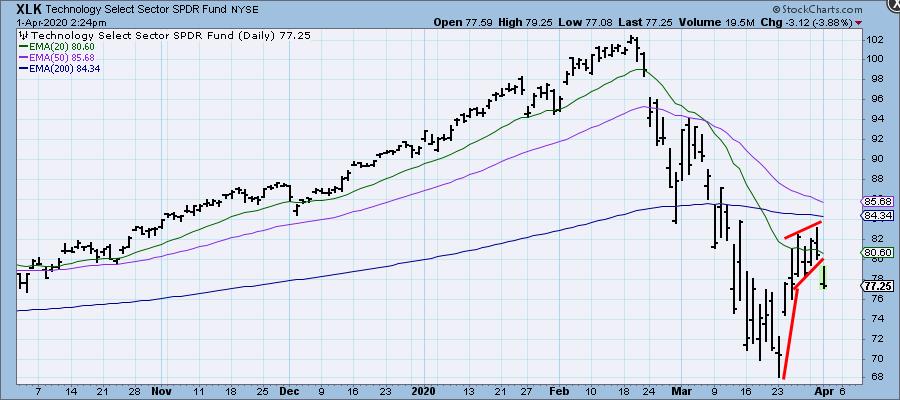
Technology has a rising flag, which normally isn't a strong bull sign, but in good times is still likely to deliver a bullish breakout.

As investors we want to accomplish two basic things: (1) Determine the trend and condition of the market, and (2) select stocks that will ride that tide. The DecisionPoint Alert helps with the first step, and DecisionPoint Diamonds helps with the second. Go to DecisionPoint.com and SUBSCRIBE TODAY!
So, what sector still offers hope of a positive breakout? Energy, although, that's not the most robust flagpole I've ever seen.
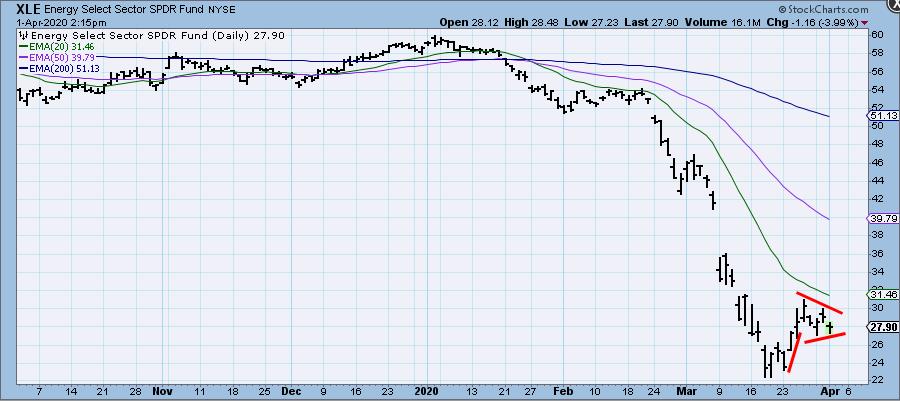
CONCLUSION: With ten of eleven sectors breaking down, it is virtually certain that a retest of the March lows is just around the corner. Bear Market Rules? The lows probably won't hold.
Happy Charting! - Carl
Technical Analysis is a windsock, not a crystal ball.
Helpful DecisionPoint Links:
DecisionPoint Alert Chart List
DecisionPoint Golden Cross/Silver Cross Index Chart List
DecisionPoint Sector Chart List
Price Momentum Oscillator (PMO)
Swenlin Trading Oscillators (STO-B and STO-V)