The S&P 500 component stocks are divided into eleven sectors, and five of them have rising wedges that have broken down. A rising wedge is a bearish formation, and, even in a bull market, it will resolve downward more often than not. In a bear market the odds of a negative resolution are even higher. The four sectors with rising wedge breakdowns this week are Consumer Staples (XLP), Health Care (XLV), Industrial (XLI), Technology (XLK), and Utilities (XLU). I wrote about XLK and XLU last week.
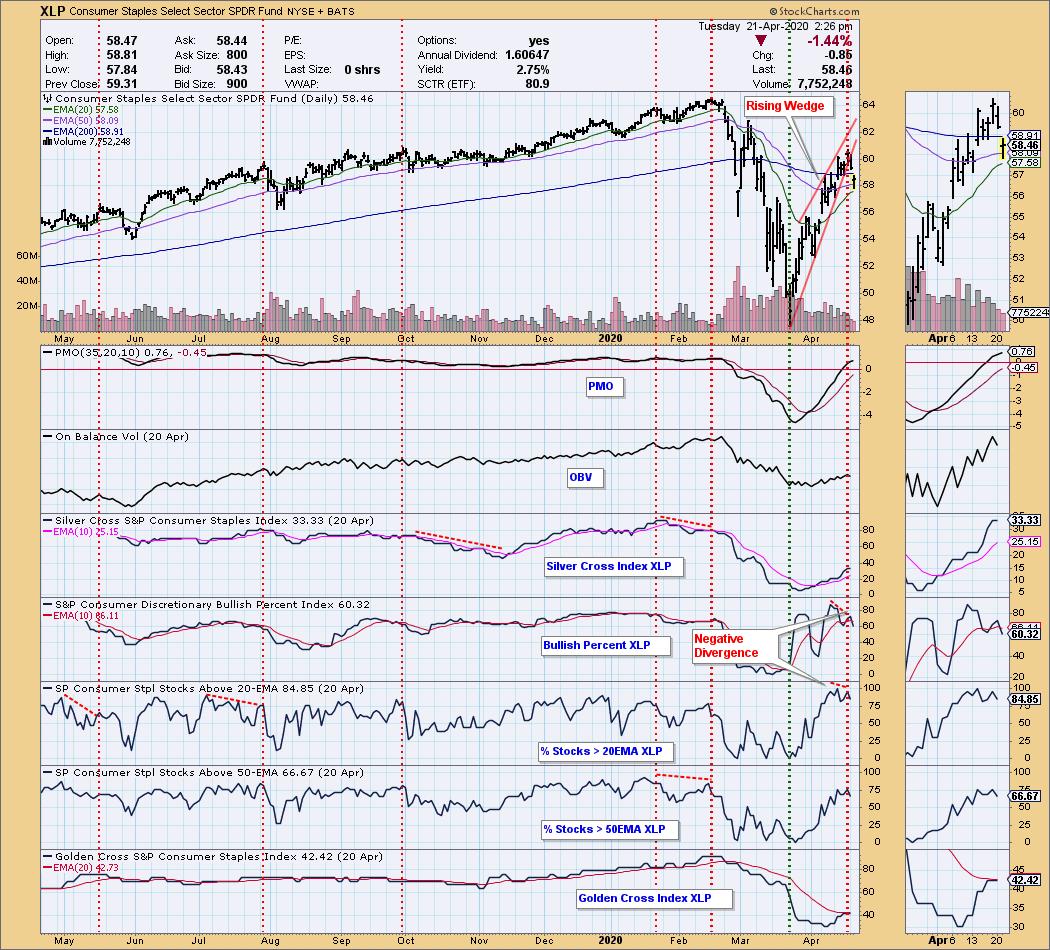
Consumer Staples: The wedge was pretty tight, but there was an overbought PMO and two short-term negative divergences, increasing the likelihood of a negative resolution.
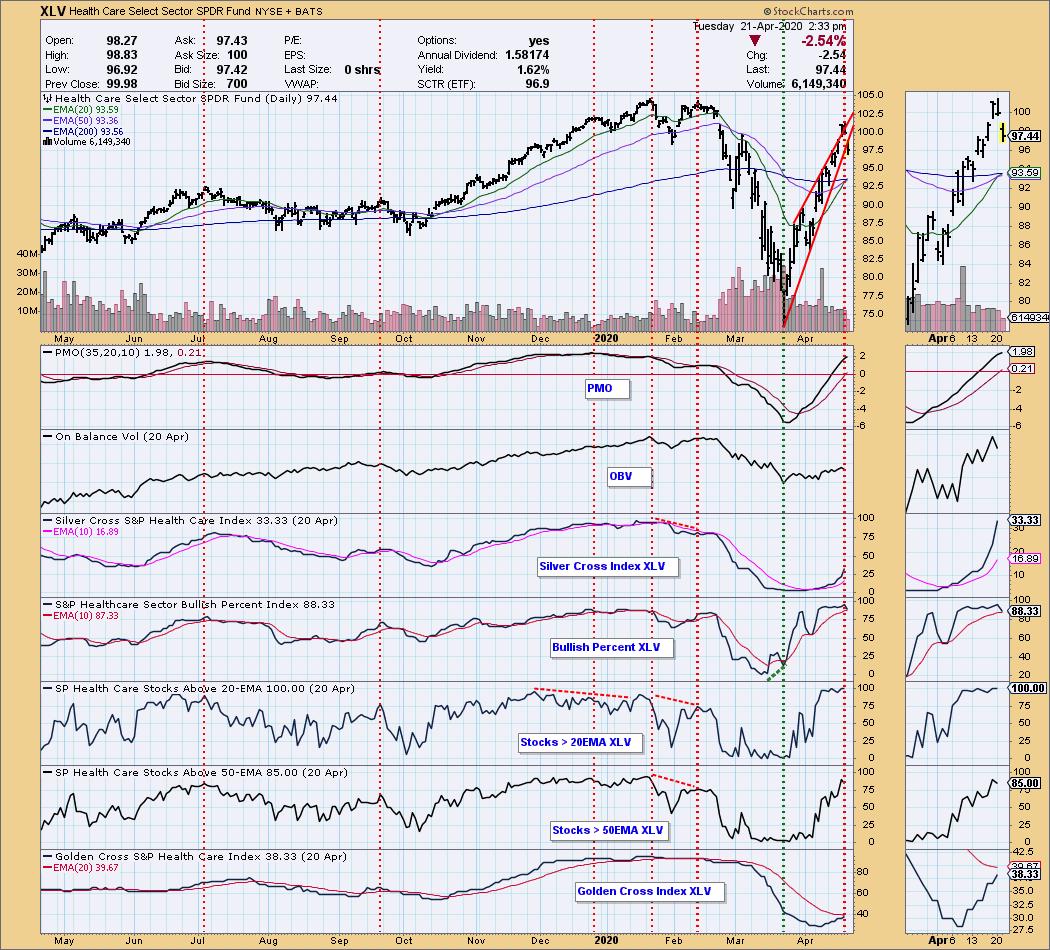
Health Care: Here's another narrow wedge, and it tried to break upwards, but that effort reversed on Monday. Price broke down on Tuesday. Also, another overbought PMO.

As investors we want to accomplish two basic things: (1) Determine the trend and condition of the market, and (2) select stocks that will ride that tide. The DecisionPoint Alert helps with the first step, and DecisionPoint Diamonds helps with the second. Go to DecisionPoint.com and SUBSCRIBE TODAY!
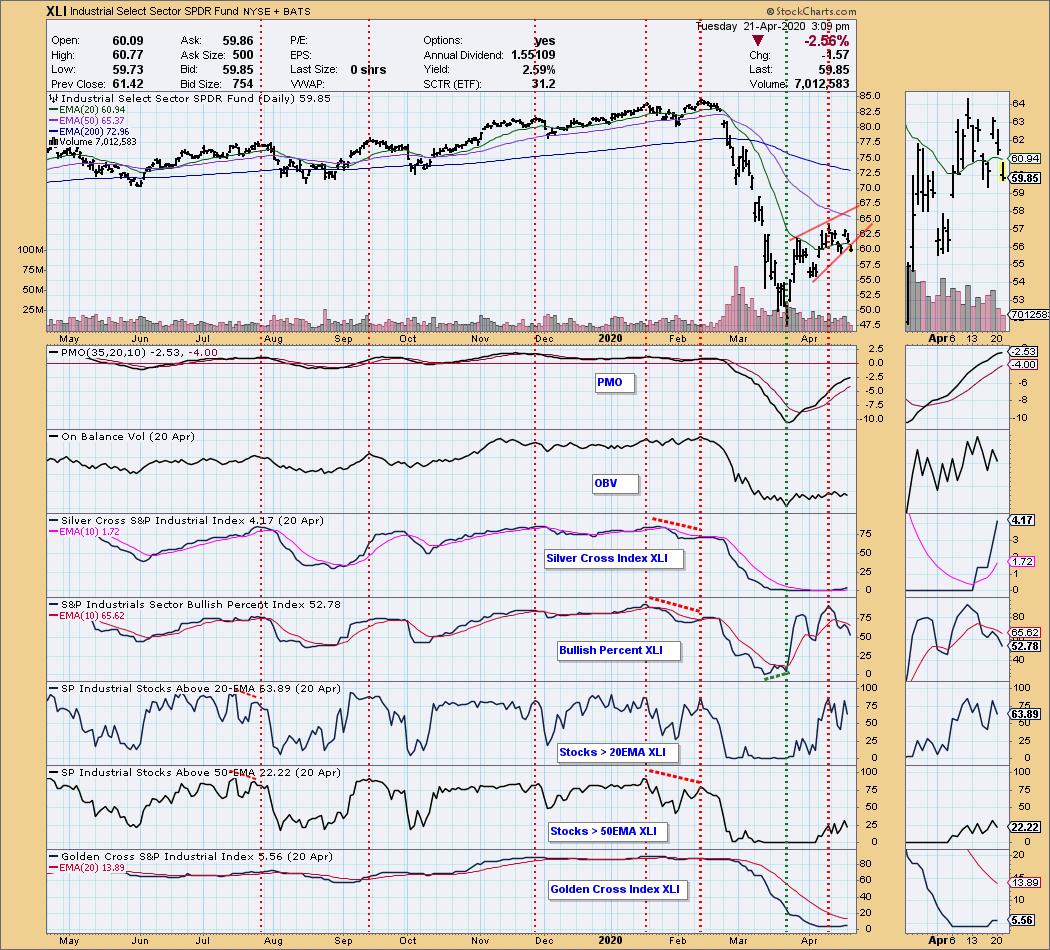
Industrial: Not as profound as the other examples in this article, but a wedge breakdown nonetheless.
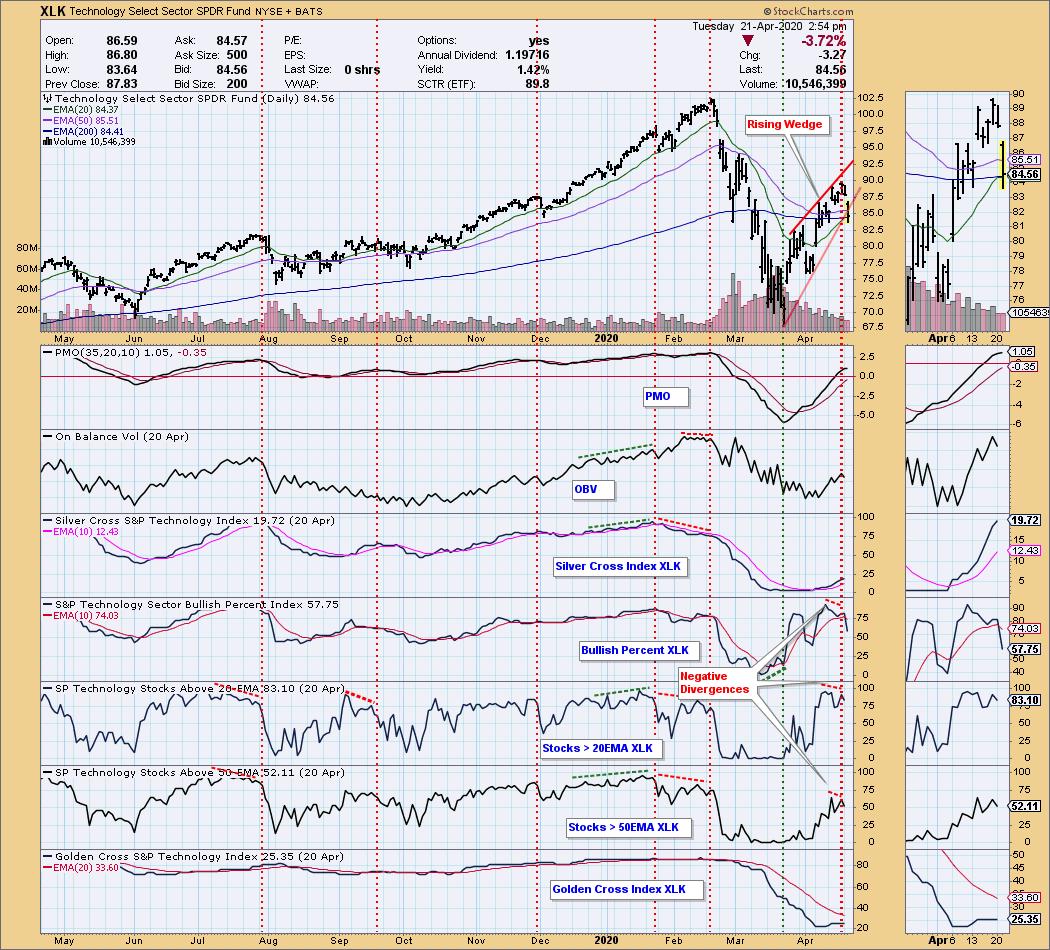
Technology: Three negative divergences emphasize the technical erosion.
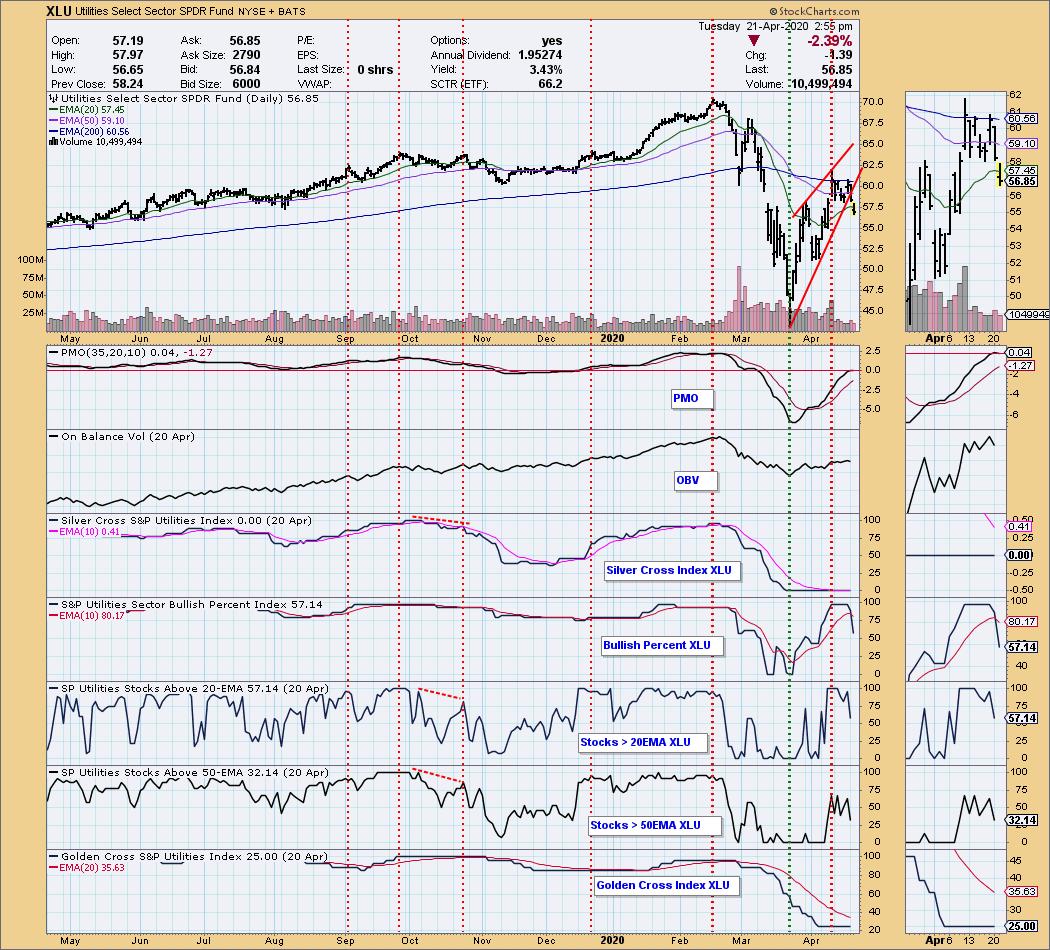
Utilities: The rising wedge itself was the only overt negative evidence preceding the April top.
CONCLUSION: Once a rising wedge breaks down, there is no certainty that price will continue to decline, but considering that the remaining six S&P 500 sectors are showing various manifestations of negative activity, not to mention the worst fundamental conditions I've ever seen, I think we should look for the March lows to be retested.
Note: Charts were made prior to today's close.
Technical Analysis is a windsock, not a crystal ball.
Helpful DecisionPoint Links:
DecisionPoint Alert Chart List
DecisionPoint Golden Cross/Silver Cross Index Chart List
DecisionPoint Sector Chart List
Price Momentum Oscillator (PMO)
Swenlin Trading Oscillators (STO-B and STO-V)